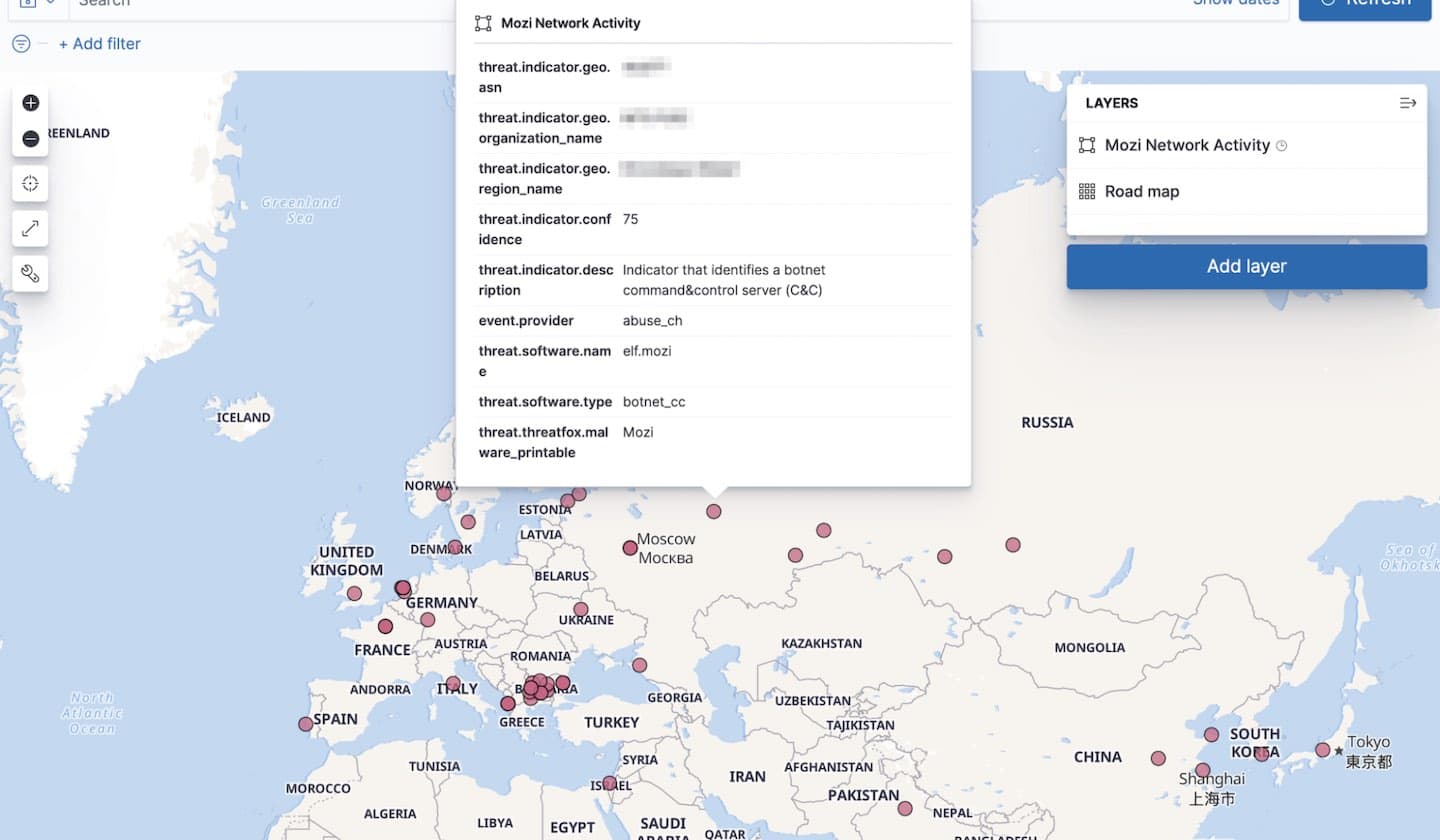
Detecting and preventing malicious activity such as botnet attacks is a critical area of focus for threat intel analysts, security operators, and threat hunters. Taking up the Mozi botnet as a case study, this blog post demonstrates how to use open source tools, analytical processes, and the Elastic Stack to perform analysis and enrichment of collected data irrespective of the campaign. This will allow you to take the lessons and processes outlined below to your organization and apply them to your specific use cases.
The Mozi botnet has been leveraging vulnerable Internet of Things (IoT) devices to launch campaigns that can take advantage of the force multiplication provided by a botnet (Distributed Denial of Service (DDoS), email spam, brute-force, password spraying, etc.). Mozi was first reported by the research team at 360Netlab in December 2019 and has continued to make up a large portion of IoT network activity across the Internet-at-large.
As reported by 360Netlab, the botnet spreads via the use of weak and default remote access passwords for targeted devices as well as through multiple public exploits. The Mozi botnet communicates using a Distributed Hash Table (DHT) which records the contact information for other nodes in the botnet. This is the same serverless mechanism used by file sharing peer-to-peer (P2P) clients. Once the malware has accessed a vulnerable device, it executes the payload and subsequently joins the Mozi P2P network. The newly infected device listens for commands from controller nodes and also attempts to infect other vulnerable devices.
Mozi targets multiple IoT devices and systems, mainly focused on Small Office Home Office (SOHO) networking devices, Internet-connected audio visual systems, and theoretically any 32-bit ARM device.
Collection
When performing data analysis, the more data that you have, the better. Analysis of malware campaigns are no different. With a paid subscription to VirusTotal, you can collect huge amounts of data for analysis, but we wanted an approach for independent researchers or smaller organizations that may not have this premium service. To do that, we decided to keep to our roots at Elastic and leverage open source datasets to avoid a paywall that could prevent others from using our processes.
To begin, we started with a handful of Mozi samples collected from ThreatFox. ThreatFox is an open source platform from Abuse.ch with the goal of sharing malware indicators with the security research community.
Using cURL, we queried the ThreatFox API for the Mozi tag. This returned back JSON documents with information about the malware sample, based on the tagged information.
curl -X POST https://threatfox-api.abuse.ch/api/v1/ -d '{ "query": "taginfo", "tag": "Mozi", "limit": 1 }'Code block 1 - cURL request to ThreatFox API
- -X POST - change the cURL HTTP method from GET (default) to POST as we’re going to be sending data to the ThreatFox API
https://threatfox-api.abuse.ch/api/v1/- this is the ThreatFox API endpoint- -d - this is denoting that we’re going to be sending data
- query: taginfo - the type of query that we’re making, taginfo in our example
- tag: Mozi - the tag that we’ll be searching for, “Mozi” in our example
- limit: 1 - the number of results to return, 1 result in our example, but you can return up to 1000 results
This returned the following information:
{
    "query_status": "ok",
    "data": [
        {
            "id": "115772",
            "ioc": "nnn.nnn.nnn.nnn:53822",
            "threat_type": "botnet_cc",
            "threat_type_desc": "Indicator that identifies a botnet command&control server (C&C)",
            "ioc_type": "ip:port",
            "ioc_type_desc": "ip:port combination that is used for botnet Command&control (C&C)",
            "malware": "elf.mozi",
            "malware_printable": "Mozi",
            "malware_alias": null,
            "malware_malpedia": "https:\/\/malpedia.caad.fkie.fraunhofer.de\/details\/elf.mozi",
            "confidence_level": 75,
            "first_seen": "2021-06-15 08:22:52 UTC",
            "last_seen": null,
            "reference": "https:\/\/bazaar.abuse.ch\/sample\/832fb4090879c1bebe75bea939a9c5724dbf87898febd425f94f7e03ee687d3b\/",
            "reporter": "abuse_ch",
            "tags": [
                "Mozi"
            ]
        }
    ]
Code block 2 - Response from ThreatFox API
Now that we have the file hashes of several samples, we can download the samples using the Malware Bazaar API. Malware Bazaar is another open source platform provided by Abuse.ch. While ThreatFox is used to share contextual information about indicators, Malware Bazaar allows for the actual collection of malware samples (among other capabilities).
Just like with ThreatFox, we’ll use cURL to interact with the Malware Bazaar API, but this time to download the actual malware samples. Of note, the Malware Bazaar API can be used to search for samples using a tag (“Mozi”, in our example), similar to how we used the ThreatFox API. The difference is that the ThreatFox API returns network indicators that we’ll use later on for data enrichment.
curl -X POST https://mb-api.abuse.ch/api/v1 -d 'query=get_file&sha256_hash=832fb4090879c1bebe75bea939a9c5724dbf87898febd425f94f7e03ee687d3b' -o 832fb4090879c1bebe75bea939a9c5724dbf87898febd425f94f7e03ee687d3b.rawCode block 3 - cURL request to Malware Bazaar API
- -X POST - change the cURL HTTP method from GET (default) to POST as we’re going to be sending data to the Malware Bazaar API
https://mb-api.abuse.ch/api/v1- this is the Malware Bazaar API endpoint- -d - this is denoting that we’re going to be sending data
- query: get_file - the type of query that we’re making, get_file in our example
- sha256_hash - the SHA256 hash we’re going to be collecting, “832fb4090879c1bebe75bea939a9c5724dbf87898febd425f94f7e03ee687d3b” in our example
- -o - the file name we’re going to save the binary as
This will save a file locally named 832fb4090879c1bebe75bea939a9c5724dbf87898febd425f94f7e03ee687d3b.raw. We want to make a raw file that we’ll not modify so that we always have an original sample for archival purposes. This downloads the file as a Zip archive. The passphrase to extract the archive is infected. This will create a local file named 832fb4090879c1bebe75bea939a9c5724dbf87898febd425f94f7e03ee687d3b.elf. Going forward, we’ll use a shorter name for this file, truncated-87d3b.elf, for readability.
Unpacking
Now that we have a few samples to work with we can look at ripping out strings for further analysis. Once in our analysis VM we took a stab at running Sysinternals Strings over our sample:
$ strings truncated-87d3b.elf
ELF
*UPX!
ELF
$Bw
(GT
...
Code block 3 - Strings output from the packed Mozi sample
Right away we see that we have a UPX packed ELF binary from the “ELF” and “UPX!” text. UPX is a compression tool for executable files, commonly known as “packing”. So the next logical step is to decompress the ELF file with the UPX program. To do that, we’ll run upx with the -d switch.
$ upx -d truncated-87d3b.elf
                       Ultimate Packer for eXecutables
                          Copyright (C) 1996 - 2020
UPX 3.96w Markus Oberhumer, Laszlo Molnar & John Reiser Jan 23rd 2020
        File size         Ratio      Format      Name
   --------------------   ------   -----------   -----------
upx.exe : upx: truncated-87d3b.elf : CantUnpackException: p_info corrupted
Code block 4 - UPX output from corrupted Mozi sample
Another road-block: the p_info section of the file appears to be corrupted. p_info is the sum of two sections from a file, p_blocksize and p_filesize . After a quick search for the error message, we landed on a CUJOAI Anti-Unpacking blog explaining the header corruptions commonly used in IoT malware to disrupt automated analysis tools.
Using this information, we cracked open our binary in xxd, a HEX dumper, to see which corruption we were dealing with. As described in the CUJOAI blog, the p_info blocks represent the sum of the p_filesize blocks and the p_blocksize blocks. This section begins with the 8 bytes after the UPX! text, and has been overwritten with zeros (the 8 bytes starting at 0x84 ).
$ xxd truncated-87d3b.elf
00000000: 7f45 4c46 0101 0161 0000 0000 0000 0000  .ELF...a........
00000010: 0200 2800 0100 0000 1057 0200 3400 0000  ..(......W..4...
00000020: 0000 0000 0202 0000 3400 2000 0200 2800  ........4. ...(.
00000030: 0000 0000 0100 0000 0000 0000 0080 0000  ................
00000040: 0080 0000 0de0 0100 0de0 0100 0500 0000  ................
00000050: 0080 0000 0100 0000 b07a 0000 b0fa 0600  .........z......
00000060: b0fa 0600 0000 0000 0000 0000 0600 0000  ................
00000070: 0080 0000 10f1 8f52 5550 5821 1c09 0d17  .......RUPX!....
00000080: 0000 0000 0000 0000 0000 0000 9400 0000  ................
00000090: 5e00 0000 0300 0000 f97f 454c 4601 7261  ^.........ELF.ra
000000a0: 000f 0200 28dd 0001 0790 b681 0334 ee07  ....(........4..
000000b0: ec28 04db 1302 0bfb 2000 031b be0a 0009  .(...... .......
...
Code block 5 - HEX view of the corrupted Mozi sample
The CUJOAI blog states that if you manually update the values of the p_filesize blocks and the p_blocksize blocks with the value of the p_info, this will fix the corruption issue. Below we can see the p_info section in HEX, and we can use that to manually update the p_filesize and p_blocksize sections, which will allow us to unpack the binary (the 4 bytes starting at 0x1e110).
$ xxd truncated-87d3b.elf
...
0001e0c0: 1914 a614 c998 885d 39ec 4727 1eac 2805  .......]9.G'..(.
0001e0d0: e603 19f6 04d2 0127 52c9 9b60 00be 273e  .......'R..`..'>
0001e0e0: c00f 5831 6000 0000 0000 90ff 0000 0000  ..X1`...........
0001e0f0: 5550 5821 0000 0000 5550 5821 0d17 0308  UPX!....UPX!....
0001e100: 5199 6237 591c 321c d001 0000 b800 0000  Q.b7Y.2.........
0001e110: 7c2a 0400 5000 0011 8000 0000            |*..P.......
Code block 6 - p_info HEX data from the corrupted Mozi sample
First, let’s open the file with Vim. As we can see, it is just a UPX file as denoted by the UPX!.
$ vim truncated-87d3b.elf
^?ELF^A^A^Aa^@^@^@^@^@^@^@^@^B^@(^@^A^@^@^@^PW^B^@4^@^@^@^@^@^@^@^B^B^@^@4^@ ^@^B^@(^@^@^@^@^@^A^@^@^@^@^@^@^@^@<80>^@^@^@<80>^@^@^Mà^A^@^Mà^A^@^E^@^@^@^@<80>^@^@^A^@^@^@°z^@^@°ú^F^@°ú^F^@^@^@^@^@^@^@^@^@^F^@^@^@^@<80>^@^@^Pñ<8f>RUPX!^\
Code block 7 - Corrupted Mozi sample in Vim
Using the xxd plugin for Vim, we can convert this to HEX so that we can make our modifications. This is achieved by typing :%!xxd, which will show us the HEX output for the file.
00000000: 7f45 4c46 0101 0161 0000 0000 0000 0000  .ELF...a........
00000010: 0200 2800 0100 0000 1057 0200 3400 0000  ..(......W..4...
00000020: 0000 0000 0202 0000 3400 2000 0200 2800  ........4. ...(.
00000030: 0000 0000 0100 0000 0000 0000 0080 0000  ................
00000040: 0080 0000 0de0 0100 0de0 0100 0500 0000  ................
00000050: 0080 0000 0100 0000 b07a 0000 b0fa 0600  .........z......
00000060: b0fa 0600 0000 0000 0000 0000 0600 0000  ................
00000070: 0080 0000 10f1 8f52 5550 5821 1c09 0d17  .......RUPX!....
00000080: 0000 0000 0000 0000 0000 0000 9400 0000  ................
00000090: 5e00 0000 0300 0000 f97f 454c 4601 7261  ^.........ELF.ra
000000a0: 000f 0200 28dd 0001 0790 b681 0334 ee07  ....(........4..
000000b0: ec28 04db 1302 0bfb 2000 031b be0a 0009  .(...... .......
Code block 8 - Corrupted Mozi sample in Vim with XXD plugin
Next, we can just update bytes 0x84 - 0x8b(that we identified as having the zero’d out p_filesize and p_blocksize) with the HEX value for p_info (7c2a 0400).
00000080: 0000 0000 7c2a 0400 7c2a 0400 9400 0000 ....|*..|*......Code block 9 - Updated p_filesize and p_blocksize HEX values
Let’s reset the file back using :%!xxd -r, save the file and exit Vim (:wq).
Finally, let’s try to unpack the file now that we’ve manually adjusted the HEX values.
$ upx -d truncated-87d3b.elf
                       Ultimate Packer for eXecutables
                          Copyright (C) 1996 - 2020
UPX 3.96        Markus Oberhumer, Laszlo Molnar & John Reiser   Jan 23rd 2020
        File size         Ratio      Format      Name
   --------------------   ------   -----------   -----------
    273020 <-    123165   45.11%    linux/arm    truncated-87d3b.elf
Unpacked 1 file.
Code block 10 - Successfully unpacked Mozi sample
We now have successfully unpacked the file. Let’s check to see what kind of file this is now by using the file command.
$ file truncated-87d3b.elf
truncated-87d3b.elf: ELF 32-bit LSB executable, ARM, version 1 (ARM), statically linked, stripped
Code block 11 - File type identification of the Mozi sample
Now, we can again use the strings command to see if there is any useful information that we can use (truncated for readability).
$ strings truncated-87d3b.elf
...
iptables -I OUTPUT -p udp --source-port %d -j ACCEPT
iptables -I PREROUTING  -t nat -p udp --destination-port %d -j ACCEPT
iptables -I POSTROUTING -t nat -p udp --source-port %d -j ACCEPT
iptables -I INPUT  -p udp --dport %d -j ACCEPT
iptables -I OUTPUT -p udp --sport %d -j ACCEPT
iptables -I PREROUTING  -t nat -p udp --dport %d -j ACCEPT
iptables -I POSTROUTING -t nat -p udp --sport %d -j ACCEPT
0.0.0.0
[idp]
This node doesn't accept announces
v2s
dht.transmissionbt.com:6881
router.bittorrent.com:6881
router.utorrent.com:6881
bttracker.debian.org:6881
nnn.nnn.nnn.nnn:6881
abc.abc.abc.abc:6881
xxx.xxx.xxx.xxx:6881
yyy.yyy.yyy.yyy:6881
NfZ
Oo~Mn
g5=
N]%
Range: bytes=
User-Agent:
...
Code block 12 - Strings output from the unpacked Mozi sample
Running Strings, we can see, among other things, network indicators and changes to the local firewall, iptables. There is a lot of great information in this file that we can now review which can be used to search for infected devices.
Next, let’s enrich the ThreatFox data, store it in Elasticsearch, and visualize it with Kibana.
Storing threat data in the Elastic Stack
Looking at what we’ve collected so far, we have rich threat data provided by ThreatFox that includes both network and file information. Additionally, we have actual malware samples collected from Malware Bazaar. Finally, we have performed static file analysis on the malware to identify additional indicators that could be of use.
For the next steps, we’re going to parse the data from ThreatFox and store that in the Elastic Stack so that we can leverage Kibana to visualize data to identify clusters of activity.
Create the Ingest Node Pipeline
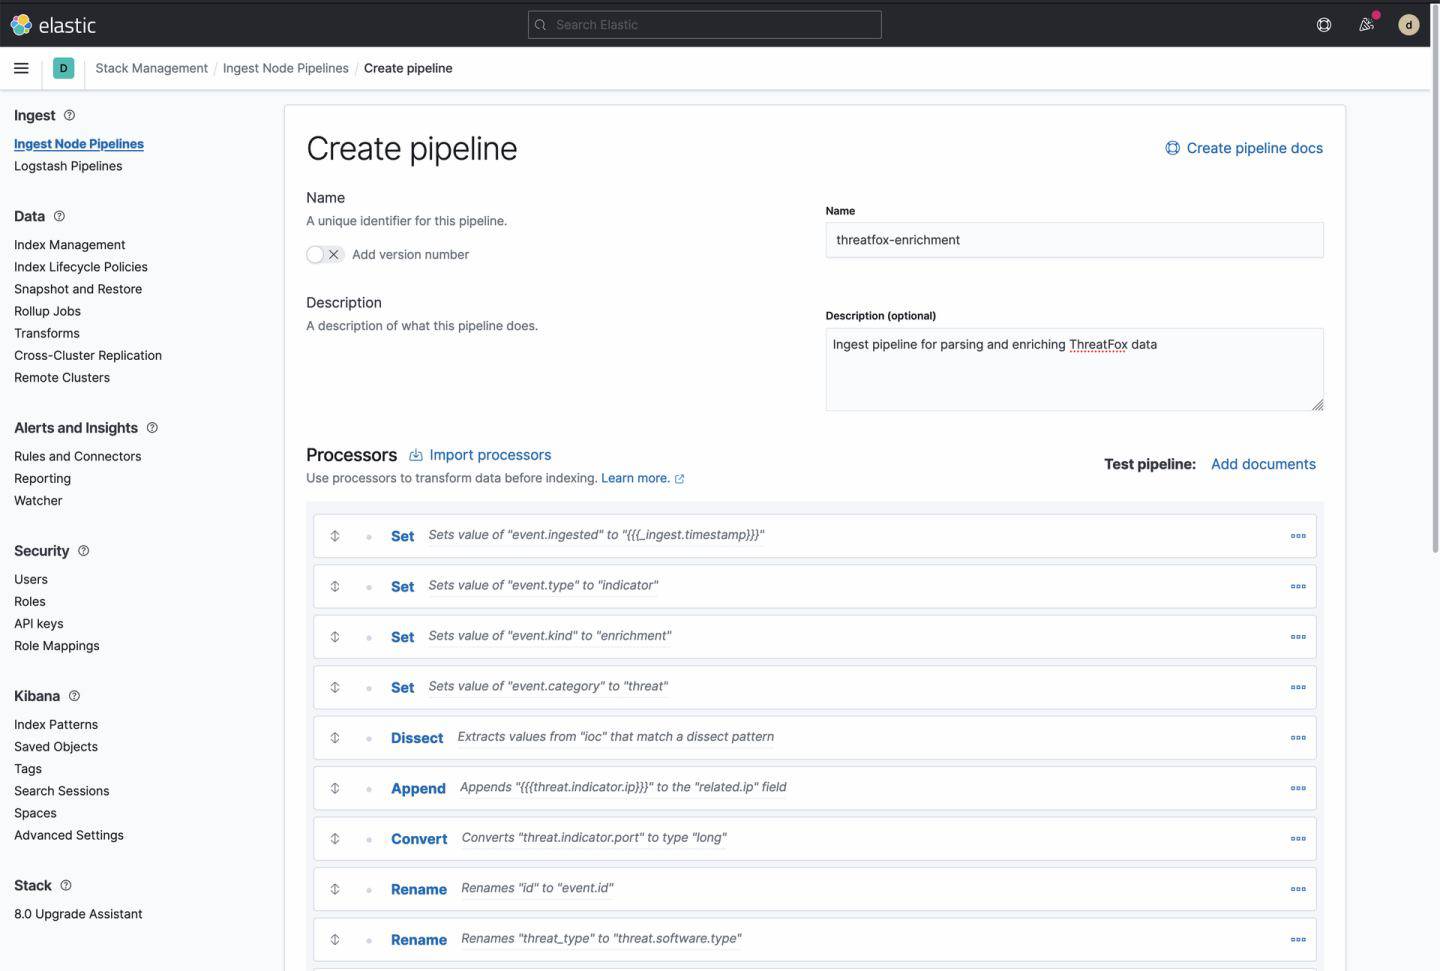
We're going to create an Ingest Node Pipeline to transform the data from ThreatFox into enriched Elasticsearch data. When making a pipeline, it's useful to make a table to lay out what we're going to do.
| ThreatFox field | ECS-style field |
| id | event.id |
| ioc | threat.indicator.ip and threat.indicator.port |
| threat_type | threat.software.type |
| threat_type_desc | threat.indicator.description |
| ioc_type | threat.indicator.type. Set threat.indicator.type to "ipv4-addr" |
| malware | threat.software.name |
| malware_printable | threat.threatfox.malware_printable |
| malware_alias | threat.software.alias (if non-null) |
| malware_malpedia | threat.software.reference |
| confidence_level | threat.indicator.confidence |
| first_seen | threat.indicator.first_seen |
| last_seen | threat.indicator.last_seen |
| reference | event.reference |
| reporter | event.provider |
| tags | tags |
<enrichment> | threat.indicator.geo. Enriched by our geoip processor. |
<parsed-sha256> | file.hash.sha256 and related.hash |
<copy threat.indicator.ip> | related.ip |
Table 1 - Elasticsearch Ingest Node Pipeline for ThreatFox data
To create the pipeline, go to Kibana Stack Management -> Ingest Node Pipelines , then click Create pipeline.

Next, we’ll give our pipeline a name, optionally a version, and a description.
From this view you can manually add processors and configure them to your liking. To give you a head start, we've provided the ThreatFox pipeline definition here you can paste in.
Click Import processors and paste the contents of this pipeline definition: pipeline.json.
When you click Load and overwrite , you'll have each processor listed there as we've configured it. From here you can tweak it to your needs, or just scroll down and click Create pipeline.
Alternatively, if you’d like to use a turnkey approach, the collection.sh script will allow you to collect the ThreatFox Mozi data, create the Elasticsearch ingest pipeline, the indicators Index, the Index Pattern, and send the data from ThreatFox directly into Elasticsearch.
$ git clone https://github.com/elastic/examples
$ cd examples/blog/mozin-about
$ sh collection.sh
Code block 13 - Using the Mozi sample collection script
Using the provided collection script, we can see the Threat Fox data is converted into the Elastic Common Schema (ECS) and sent to Elasticsearch for analysis.
Figure 3 - ThreatFox data in Kibana
Analysis
Now that we’ve collected our samples, enriched them, and stored them in Elasticsearch, we can use Kibana to visualize this data to identify clusters of activity, make different observations, and set up different pivots for new research.
As a few quick examples, we can identify some ports that are used and countries that are included in the dataset.
Let’s start with identifying high-density network ports. Make a Lens visualization in Kibana by clicking on Visualization Library → Create visualization → Lens. We can make a simple donut chart to highlight that the threat.indicator.port of 6000 makes up over 10% of the network ports observed. This could lead us to explore other network traffic that is using port 6000 to identify other potentially malicious activity.
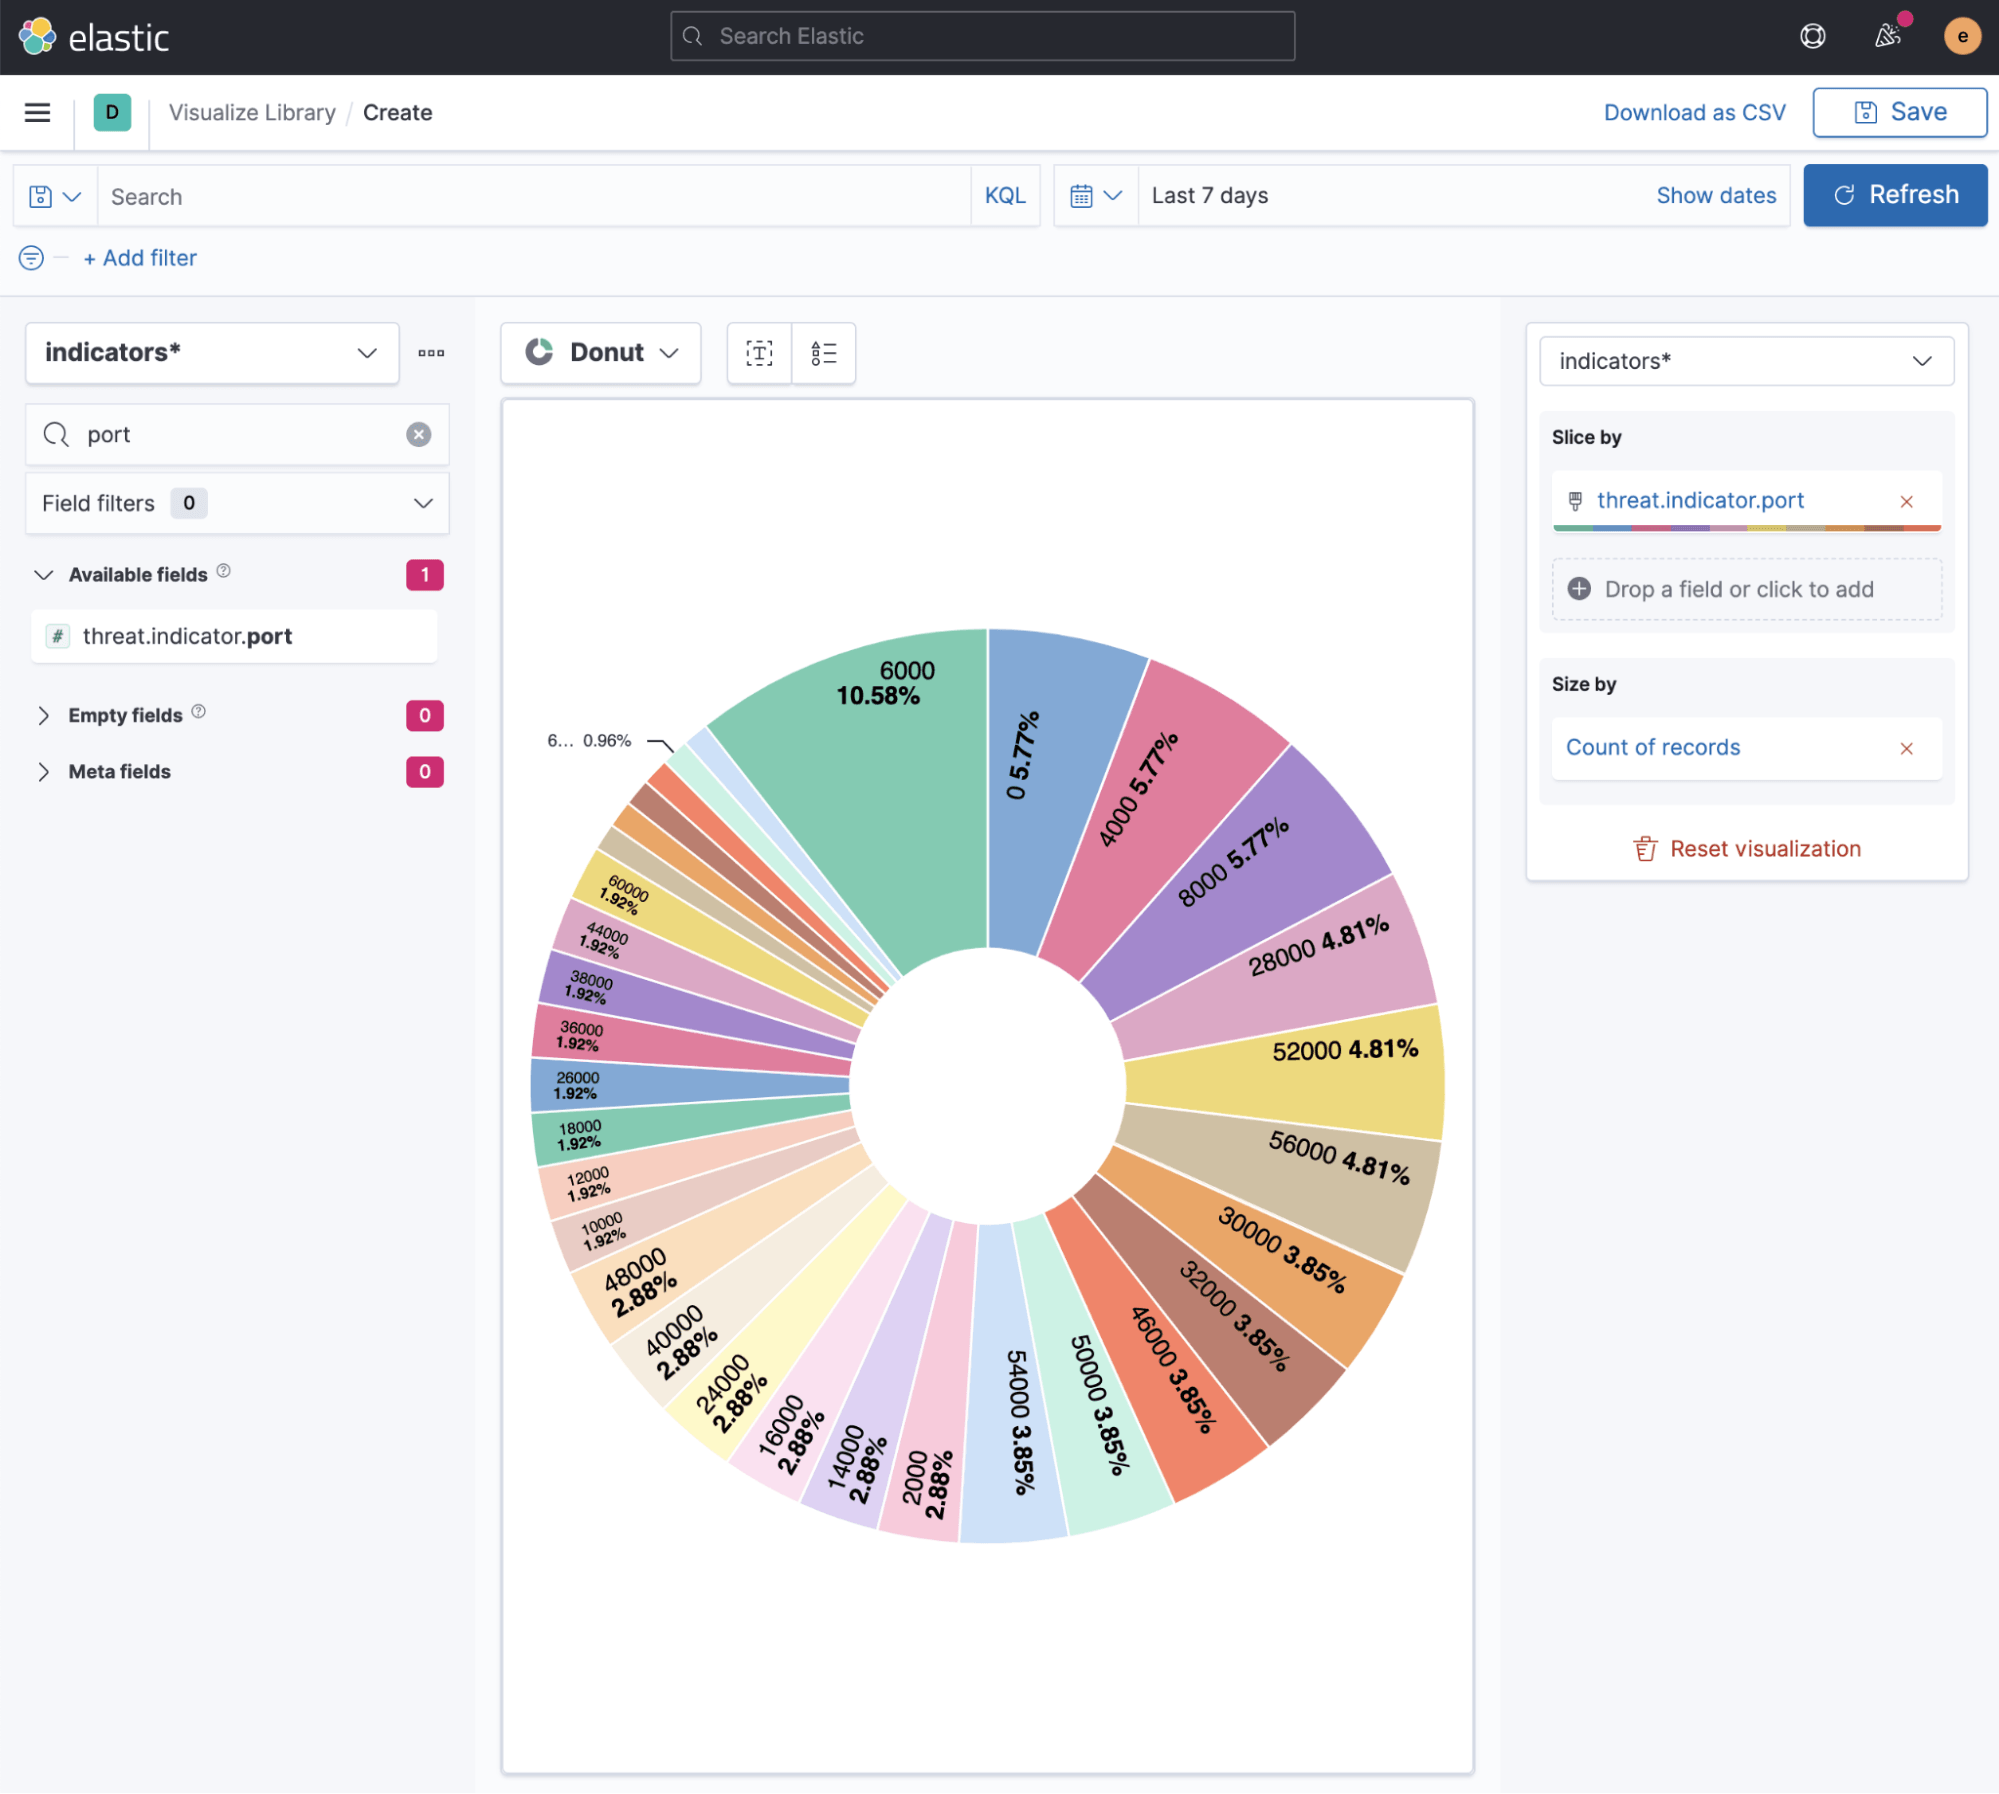
Of note, port 0 and 4000 are also observed and are interesting. Ports 6000, 4000, nor 0 are overly common on the Internet-at-large and could be used to identify other compromised hosts. It should be noted that while transient network indicators like IP and port are useful, they should not be used as the sole source to identify malicious activity irrespective of the intrusion set being investigated.
Next, we can use a Kibana Maps visualization to identify geographic clusters of activities, and include associated context such as indicator confidence, provider, and type.
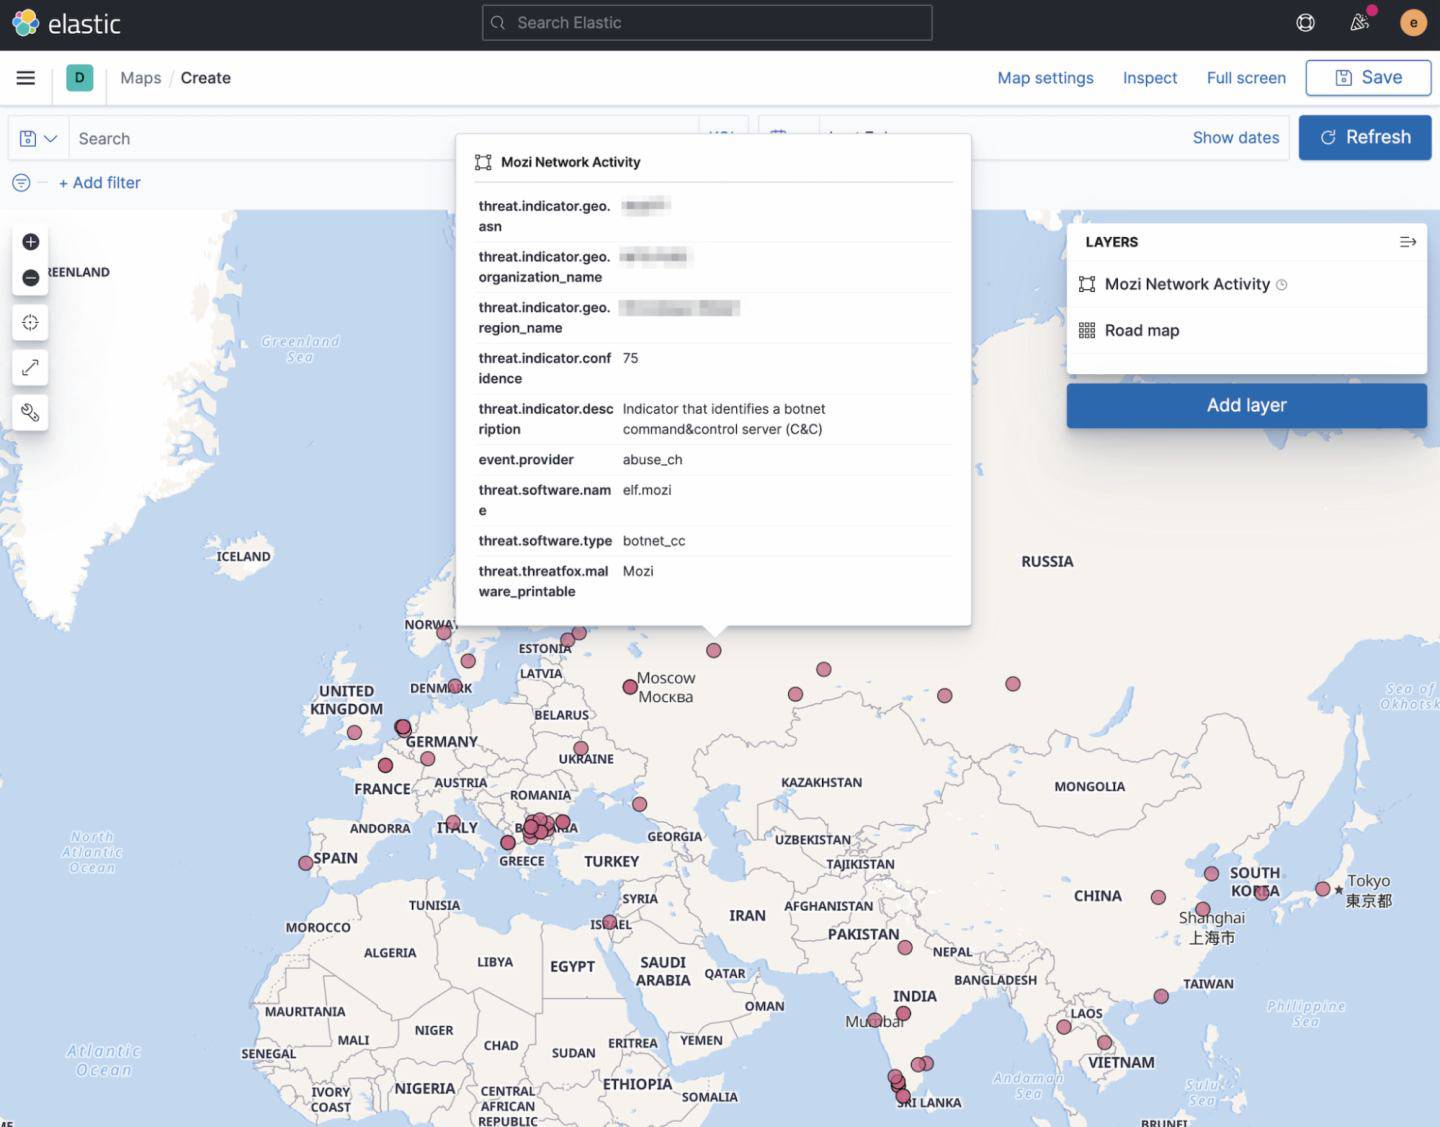
Similar to the commentary above on IP and ports, geographic observations should not be the sole source used to take action. These are simply indicators for observed samples and require organizational-centric analysis to ascertain their meaning as it relates to the specific network.
This is useful information we can make the following analytical assertions based on our sampling:
- Mozi botnet is currently active and maintaining steady infection rates
- Port 6000 is a dominant port used for command & control
- At least 24 countries impacted suggests global threat with no specific targeting
- Clusters of specific ASNs in Bulgaria and India stand out with highest volumes
As the analysis process starts to flow, it ends up providing additional avenues for research. One example an analyst may pursue is a propagation mechanism through the use of HTTP fingerprinting.
Exploring the propagation mechanism
In the same manner as criminal fingerprints are tracked and logged in a database, a similar technique can be applied to publicly facing network infrastructure. An HTTP request can be sent to a webserver and the HTTP response that is returned can be used to identify possible web applications hosted on the server; even the ordering of the fields in the HTTP response can be used as an identifier.
One thing we learned about Mozi and how it contributes to its spreading power is that each compromised device contributes to the infection of future victims. The compromised device starts an HTTP server that hosts a Mozi payload on a random TCP port. Knowing this information, we can collect content from an infected system to generate a fingerprint using cURL.
curl -I nnn.nnn.nnn.nnn:53822
HTTP/1.1 200 OK
Server: nginx
Content-Length: 132876
Connection: close
Content-Type: application/zip
Code block 14 - HTTP response from a compromised device
Based on the observed response back, we can pull back some interesting information such as:
- The use of an NGINX web server
- No HTTP Date Header provided
- The size of the file returned is close to 133 kilobytes
With this small amount of data, we can pivot to different search engines that store response data from these kinds of devices all over the world. By leveraging tools like Shodan, we can perform a search using the information obtained in the HTTP response. We’ll wildcard the Content-Length but use the same order for all of the HTTP response elements:
HTTP/1.1 200 OK Server: nginx Content-Length: * Connection: close Content-Type: application/zipCode block 15 - HTTP header for Mozi propagation
We can see a number of hits where this same response was captured on other devices and start to pinpoint additional machines. Below are a few examples from a Shodan search:
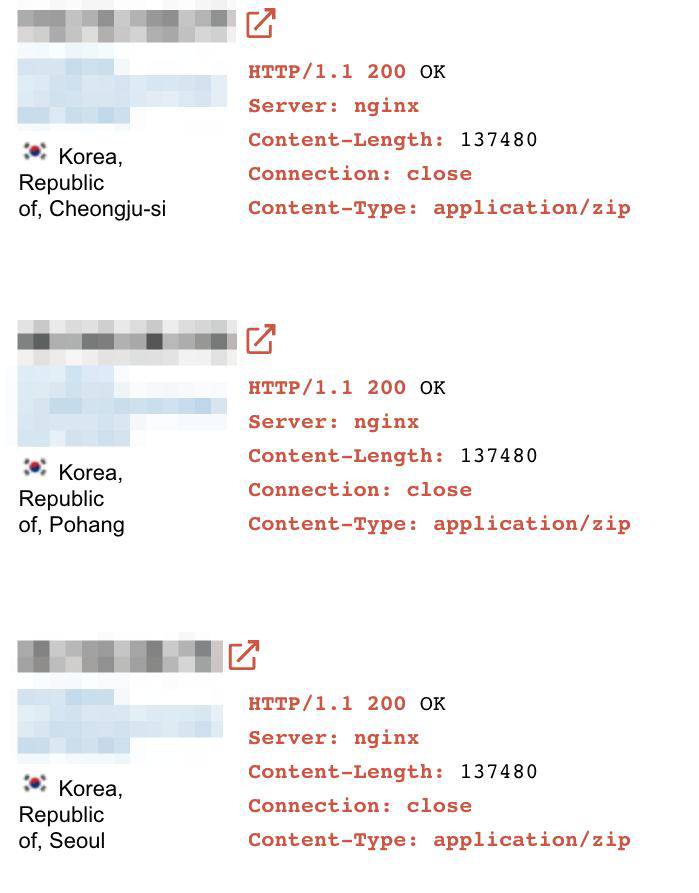
Other search examples over response data could be used as well such as the actual bytes of the malicious Mozi file that was returned in the response.
Mitigation
The Mozi botnet propagates through the abuse of default or weak remote access passwords, exploits and outdated software versions. To defend devices from exploitation, we recommend:
- Changing the device default remote access passphrases
- Updating devices to the latest firmware and software version supported by the vendor
- Segmenting IoT devices from the rest of your internal network
- Not making IoT devices accessible from the public Internet
Detection logic
Using YARA, we can write a signature for the corrupted UPX header. Similar to rules that look for specific types of PowerShell obfuscation, the obfuscation mechanism itself can occasionally be a better indicator of maliciousness than attempting to signature the underlying activity. It is extremely important to note that zeroing out part of the header sections was the technique that we observed with our samples. There are a litany of other obfuscation and anti-analysis techniques that could be used with other samples. MITRE ATT&CK® describes additional subtechniques for the Obfuscated Files or Information technique from the Defense Evasion tactic.As noted above, the observed anti-analysis technique used by the analyzed Mozi samples consists solely of zeroing out the 8 bytes after the “UPX!” magic bytes, and the 4 bytes before that are always zero, so let's use a YARA signature derived from the work by Lars Wallenborn (expanded for readability).
rule Mozi_Obfuscation_Technique
{
  meta:
    author =  "Elastic Security, Lars Wallenborn (@larsborn)"
    description = "Detects obfuscation technique used by Mozi botnet."
  strings:
    $a = { 55 50 58 21
           [4]
           00 00 00 00
           00 00 00 00
           00 00 00 00 }
  condition:
    all of them
}
Code block 16 - YARA signature detecting Mozi obfuscation
- 55 50 58 21 - identifies the UPX magic bytes
- [4] - offset by 4 bytes, the l_lsize, l_version & l_format
- 00 00 00 00 - identifies the program header ID
- 00 00 00 00 - identifies the zero’d out p_filesize
- 00 00 00 00 - identifies the zero’d out p_blocksize
- condition - requires that all of the above strings exist for a positive YARA signature match
The above YARA signature can be used to identify ELF files that are packed with UPX and have the header ID, p_filesize, and p_blocksize elements zero’d out. This can go a long way in identifying obfuscation techniques in addition to Mozi samples. In our testing, we used this YARA signature with a 94.6% efficiency for detecting Mozi samples.
Summary
The Mozi botnet has been observed targeting vulnerable Internet of Things (IoT) devices to launch seemingly non-targeted campaigns that can take advantage of the force multiplication provided by a botnet. Mozi has been in operation since at least December 2019.
We covered techniques to collect, ingest, and analyze samples from the Mozi botnet. These methodologies can also be leveraged to enhance and enable analytical processes for other data samples.
Additional resources
- Blog artifacts and scripts, Elastic: https://github.com/elastic/examples/tree/master/blog/mozin-about
- ThreatFox Indicator of Compromise Database, Abuse.ch: https://threatfox.abuse.ch/browse
- UPX Anti-Unpacking Techniques in IoT Malware, CUJOAI: https://cujo.com/upx-anti-unpacking-techniques-in-iot-malware
- Corrupted UPX Packed ELF Repair, vcodispot.com: https://vcodispot.com/corrupted-upx-packed-elf-repair
- UPX PACKED ELF BINARIES OF THE PEER-TO-PEER BOTNET FAMILY MOZI, Lars Wallenborn: https://blag.nullteilerfrei.de/2019/12/26/upx-packed-elf-binaries-of-the-peer-to-peer-botnet-family-mozi
- Mozi, Another Botnet Using DHT, 360 Netlab: https://blog.netlab.360.com/mozi-another-botnet-using-dht
- Mozi Botnet Accounts for Majority of IoT Traffic, Tara Seals: https://threatpost.com/mozi-botnet-majority-iot-traffic/159337
- New Mozi P2P Botnet Takes Over Netgear, D-Link, Huawei Routers, Sergiu Gatlan: https://www.bleepingcomputer.com/news/security/new-mozi-p2p-botnet-takes-over-netgear-d-link-huawei-routers
- Kibana Maps, Elastic: https://www.elastic.co/guide/en/kibana/current/maps.html
- Kibana Lens, Elastic: https://www.elastic.co/guide/en/kibana/current/lens.html
