As many organizations have migrated their infrastructure, applications, and data to cloud offerings, adversaries have extended their operational capabilities in cloud environments to achieve their mission — whether that means stealing intellectual property, disrupting business operations, or holding an organization's data for ransom. In order to protect our users' data from attack, the Elastic Security Intelligence & Analytics Team researches and develops rules to detect attacker behavior in the cloud and on the endpoint.
In this post, we'll discuss cloud monitoring and detection-related challenges security operations teams face, and why attacks against cloud environments are often successful. We will share details on our free cloud detection rules (including many new ones released in Elastic Security 7.9) and show how they can help Elastic Security users.
We'll also explain how Elastic can ingest logs from a wide variety of cloud platforms and how the Elastic Common Schema (ECS) makes searching, monitoring, and detection easy for defenders.
Cloud monitoring and detection challenges
Security teams typically encounter one or more of the following challenges when they're asked to monitor, detect, and respond to threats in their organization's cloud environments:
- Resource constraints: It can take a considerable amount of time to learn and understand cloud technologies and their ever-changing data sources. Many security operations teams do not have the resources to allocate to this ongoing effort.
- Understanding of adversary tradecraft: Attacker behavior on well-known platforms such as Windows has been researched extensively and shared with the security community. Security teams may not have an in-depth understanding of how adversaries operate in cloud environments or the ability to provision a test environment to practice offensive and defensive techniques to protect their organization.
- Blind spots: For effective monitoring and detection, the data available to security practitioners must be relevant, accurate, and timely. Cloud logs shipped to a SIEM can be used for detection and response as long as the security team can depend on the quality of the data.
- Data normalization: Most cloud platforms have their own log categories and event schema. Normalizing logs into a common schema is not a trivial or one-off task. Some security teams, for example, have several different field names for a hostname across their data sources indexed in their SIEM. Without a normalized and documented schema, it can be difficult for analysts — especially less experienced ones — to write search queries and correlate events across data sources effectively.
Ingesting and searching cloud logs with Elastic
Elastic has a large collection of Filebeat modules that can be used to simplify the collection, parsing, and visualization of many diverse log formats into a common schema — including cloud platforms such as Amazon Web Services (AWS), Azure, Okta, and Office 365. Rapid development of new Filebeat modules is an ongoing process.
The Elastic Common Schema (ECS) defines a common set of fields for ingesting logs from a connected data source (e.g., AWS/Okta) into Elasticsearch. Log data is normalized into a format where the various field names can be used in queries to correlate behavior across data sources. This is useful to security and IT operations teams for a number of reasons.
Practitioners and administrators do not need to spend countless hours transforming or normalizing their ingested logs so that the field names follow their own common schema. Managing a schema like this yourself is no small undertaking and is a continuous effort. Elastic manages ECS (saving users time and resources) so that security teams can rely on a common set of field names to search their data quickly and efficiently.
End users can rely on using the same field names in their queries when searching across multiple data sources, which presents the following advantages:
- Having a consistent schema for searching saves security analysts time and lowers the barrier to entry for new analysts. Analysts don't have to learn or remember all of the different field names and their purpose for each data source.
- Analysts can correlate events across data sources such as endpoint, proxy, and firewall, which helps them ask questions of their data more efficiently and make sound decisions during an investigation, incident, or hunt.
- It's easy for analysts to produce a timeline or build a visualization of the activity that occurred.
Detecting attackers operating in cloud environments
The Elastic Security Intelligence & Analytics Team's research into adversary tradecraft leads to new detection features like rules and machine learning jobs — capabilities that enable small security teams to have an outsized impact. Security features like these increase the cost of an attack for adversaries. Elastic Security users can expect to see a continued focus on increasing the cost of cloud attacks.
In the remainder of this blog post, we'll simulate attack techniques against AWS and Okta cloud environments. We'll review the alerts that are generated by the suspicious activity and how an analyst can perform initial triage and complete their investigation using Elastic Security. We will also demonstrate how analysts can add exceptions to detection rules in order to filter benign events and continue to alert on suspicious behavior.
Monitoring AWS CloudTrail logs to detect suspicious behavior
As organizations migrate to or provision new infrastructure in cloud platforms like AWS, they face the common challenges that we described earlier. Fortunately, Elastic Security has a strong variety of AWS rules, available for free in 7.9 to detect suspicious behaviors in an AWS environment.
The Filebeat module for AWS helps you easily ship CloudTrail, Simple Storage Service (S3), Elastic Load Balancing (ELB), and virtual private cloud (VPC) flow logs to Elasticsearch for monitoring and detection in Elastic Security. Let's walk through an attack and defense scenario utilizing CloudTrail data. CloudTrail provides event history of your AWS account activity, including actions taken through the AWS Management Console, AWS software development kits (SDKs), command line tools, and other AWS services. This event history can help simplify security detection, analysis, and investigations.
Many attacks against AWS start with an attacker obtaining an access key and/or the secret access key details. These keys may be harvested in a variety of ways, including through phishing, a data breach, GitHub repositories, screenshots, error messages, snapshot data, or simply poor key management practices. By obtaining these keys, an attacker can take a variety of actions against your AWS infrastructure.
Let's walk through one of the many potential attack scenarios that could play out. In the following example, the adversary enumerates the trails and monitoring capabilities that have been configured for the AWS account. They follow up on this activity by disabling a trail and a configuration recorder in an attempt to evade detections and then proceed to harvest secrets.
Simulating adversary behavior in AWS
In this demonstration, we'll use Pacu to perform our attack. Pacu is a popular framework for exploiting AWS infrastructure, developed and maintained by Rhino Security Labs. Pacu is modular, similar to other exploitation frameworks like Metasploit and Koadic, and enables attackers to exploit configuration flaws within an AWS account. Attackers can use Pacu to check if the required permissions are assigned to the compromised account before attempting to execute a module. This can be helpful from an attacker's perspective to not create unnecessary noise and logs, and draw additional attention from defenders by running modules that will ultimately fail.
The attacker begins by enumerating services using the detection__enum_services module to determine what logging and monitoring services are enabled for the AWS account.
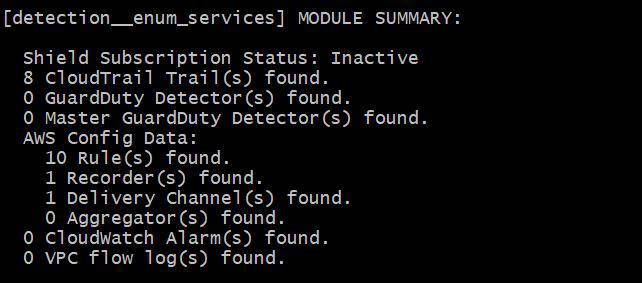
The attacker discovered eight trails, as well as ten configuration rules, a recorder, and a delivery channel. Essentially, the enumeration script is querying certain AWS API calls to list or describe relevant information about the environment. By reviewing the code of the module, we can see the targeted APIs:
DescribeSubscription
GetSubscriptionState
DescribeTrails
ListDetectors
DescribeConfigRules
DescribeConfigurationRecorders
DescribeConfigurationRecorderStatus
DescribeDeliveryChannels
DescribeDeliveryChannelStatus
DescribeConfigurationAggregators
DescribeAlarms
DescribeFlowLogs
After the attacker determines which services are running, their next logical step may be to interrupt logging and monitoring by disabling a trail, alarm, detector, or recorder in an attempt to evade detection. To accomplish this objective, we'll use a different module called detection__disruption to disable a trail called brentlog, and stop the configuration recorder named default.

At this point, with trail logging suspended and the configuration recorder turned off from tracking changes to resources, the attacker may want to check if there are any credentials, API keys, or tokens available in Secrets Manager and if so, collect them. In this scenario, the attacker uses the enum_secrets module and finds one secret in the directory, /sessions/brent/downloads/secrets/secrets_manager. Harvesting these secrets could help the adversary achieve lateral movement and/or privilege escalation.


We'll stop our fictitious attack scenario here, but if you're curious to learn what the attacker could do next, the following Google search will return some examples: intitle:"AWS" intext:("attack" | "breach"). In the next section, we'll look at what this behavior looks like from a defender's perspective and how Elastic Security can be used to detect this behavior.
Detecting and investigating the suspicious behavior in AWS
While monitoring the usage of the previously mentioned APIs, it can be difficult to distinguish benign activity from suspicious behavior, such as an attacker enumerating an environment. In production environments, monitoring for calls to these APIs can be noisy, as the behavior is quite common. To help find this rare and potentially suspicious behavior, and in addition to the AWS detection rules we have available, we've released machine learning jobs in 7.9 specifically for AWS CloudTrail that help identify outliers, such as patterns of unusual activity that are hard to find using conventional detection rules.
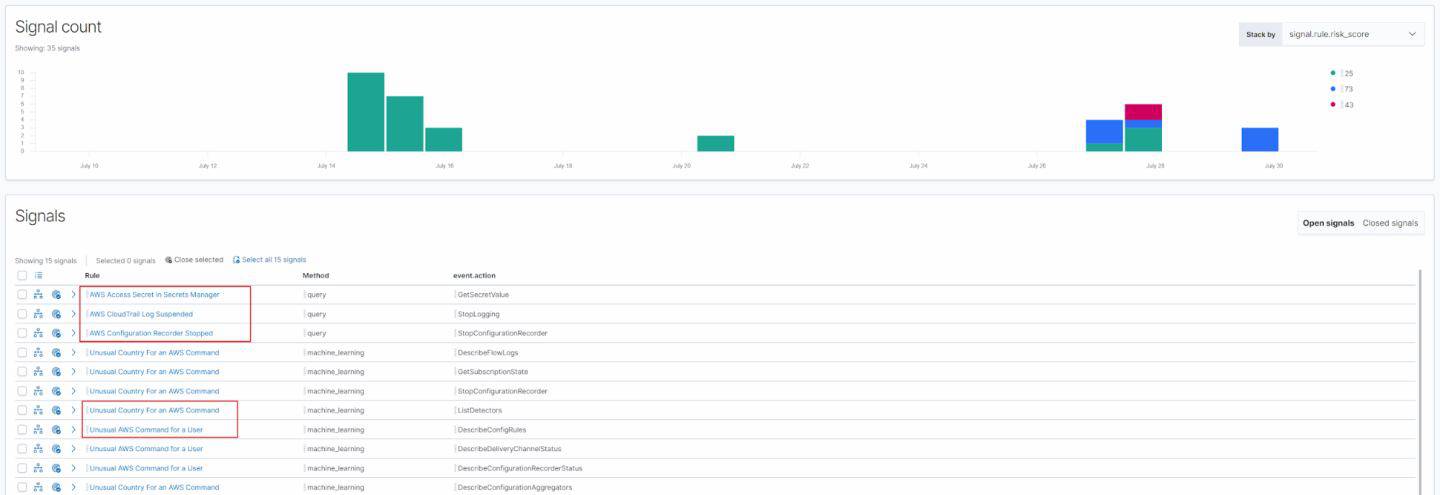
Looking at our detections page from the previous attack, we can see multiple alerts were triggered. Our free built-in detection rules identified the techniques of suspending a trail, stopping a configuration recorder, and grabbing sensitive information from the secrets manager. The other alerts are from the machine learning jobs of Unusual Country For an AWS Command and Unusual AWS Command for a User which identify a geolocation (country) that is unusual for the command or a user context that does not normally use the command.
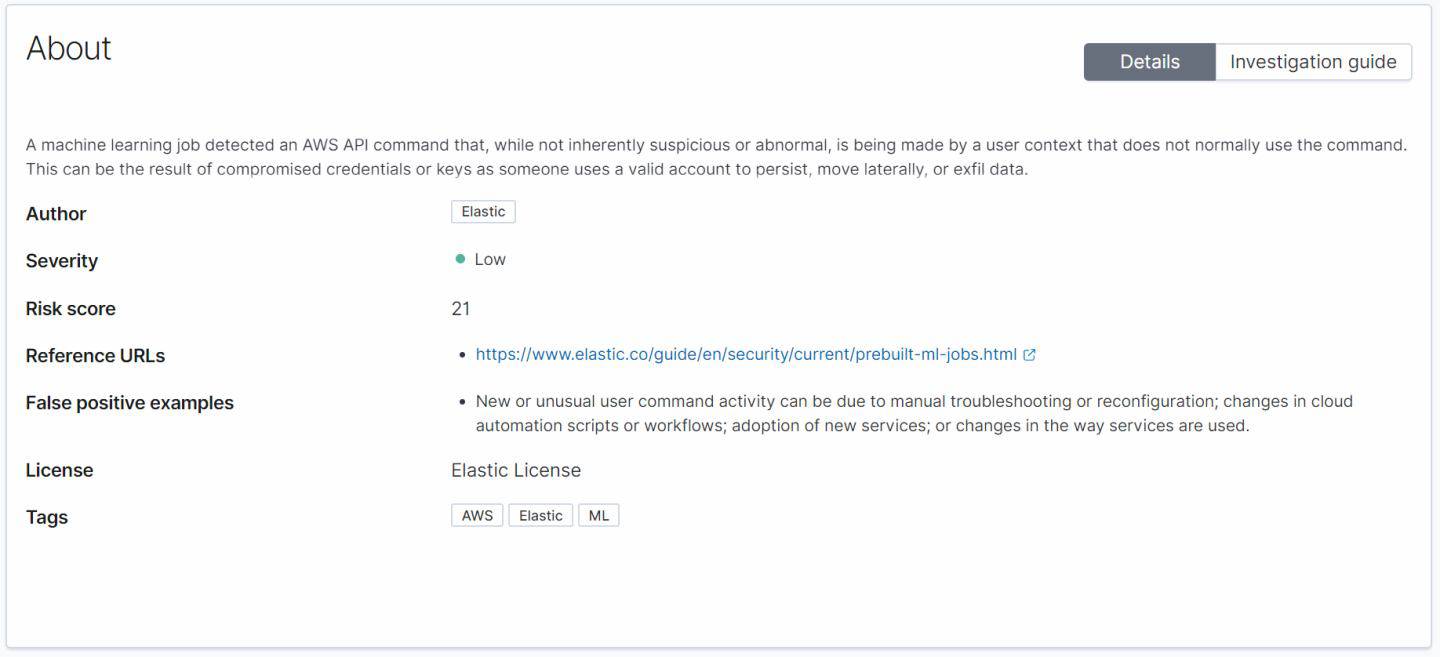
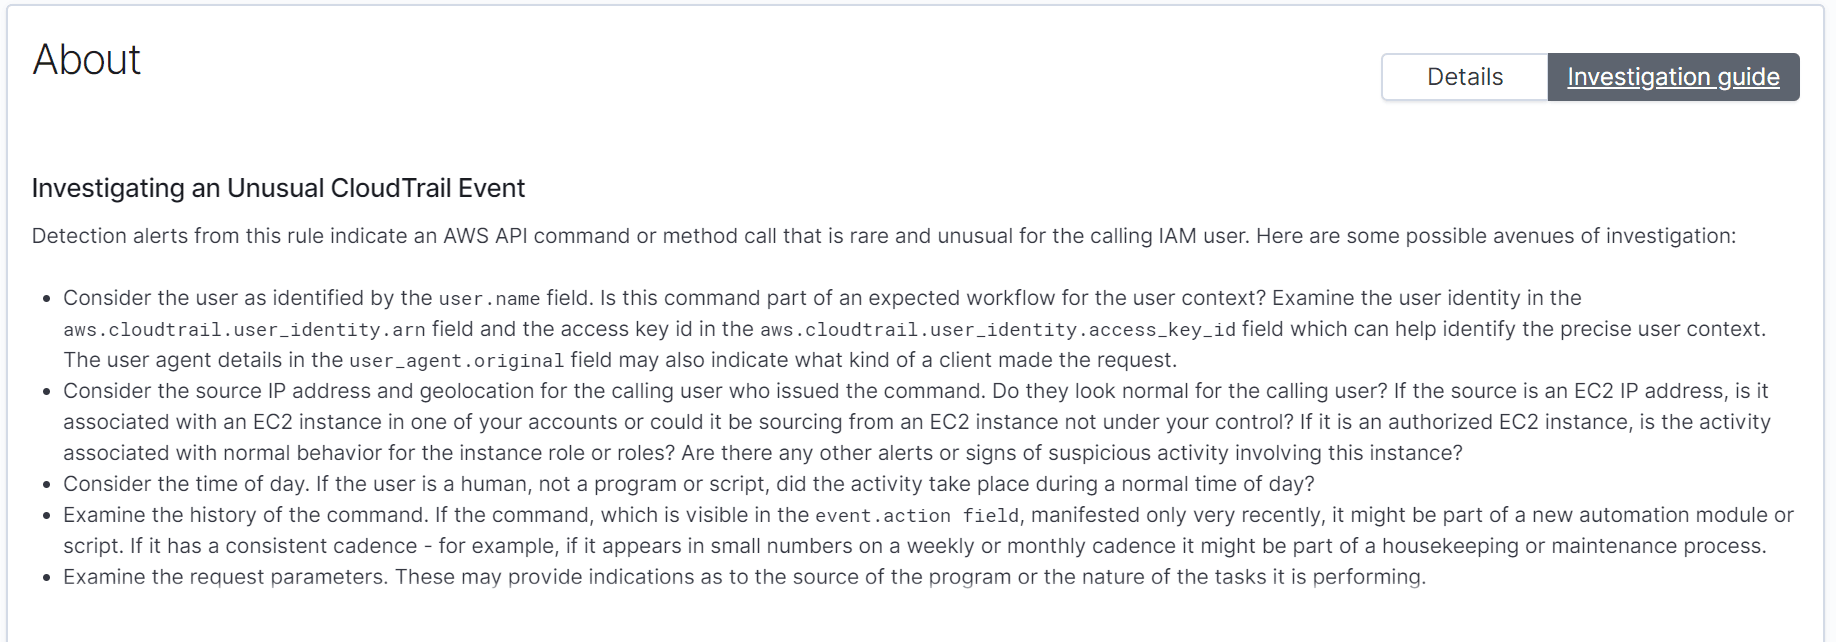
If we pivot into one of the machine learning alerts, we can see a description of what it detected, along with a built-in investigation guide to walk an analyst through a potential workflow when analyzing an unusual CloudTrail event.
Let's also take a look at the details in the Timeline view from the AWS Configuration Recorder Stopped alert. The fields I'm particularly interested in are the API call, user agent string, user identity type, request parameters, and the raw text of the entire event.
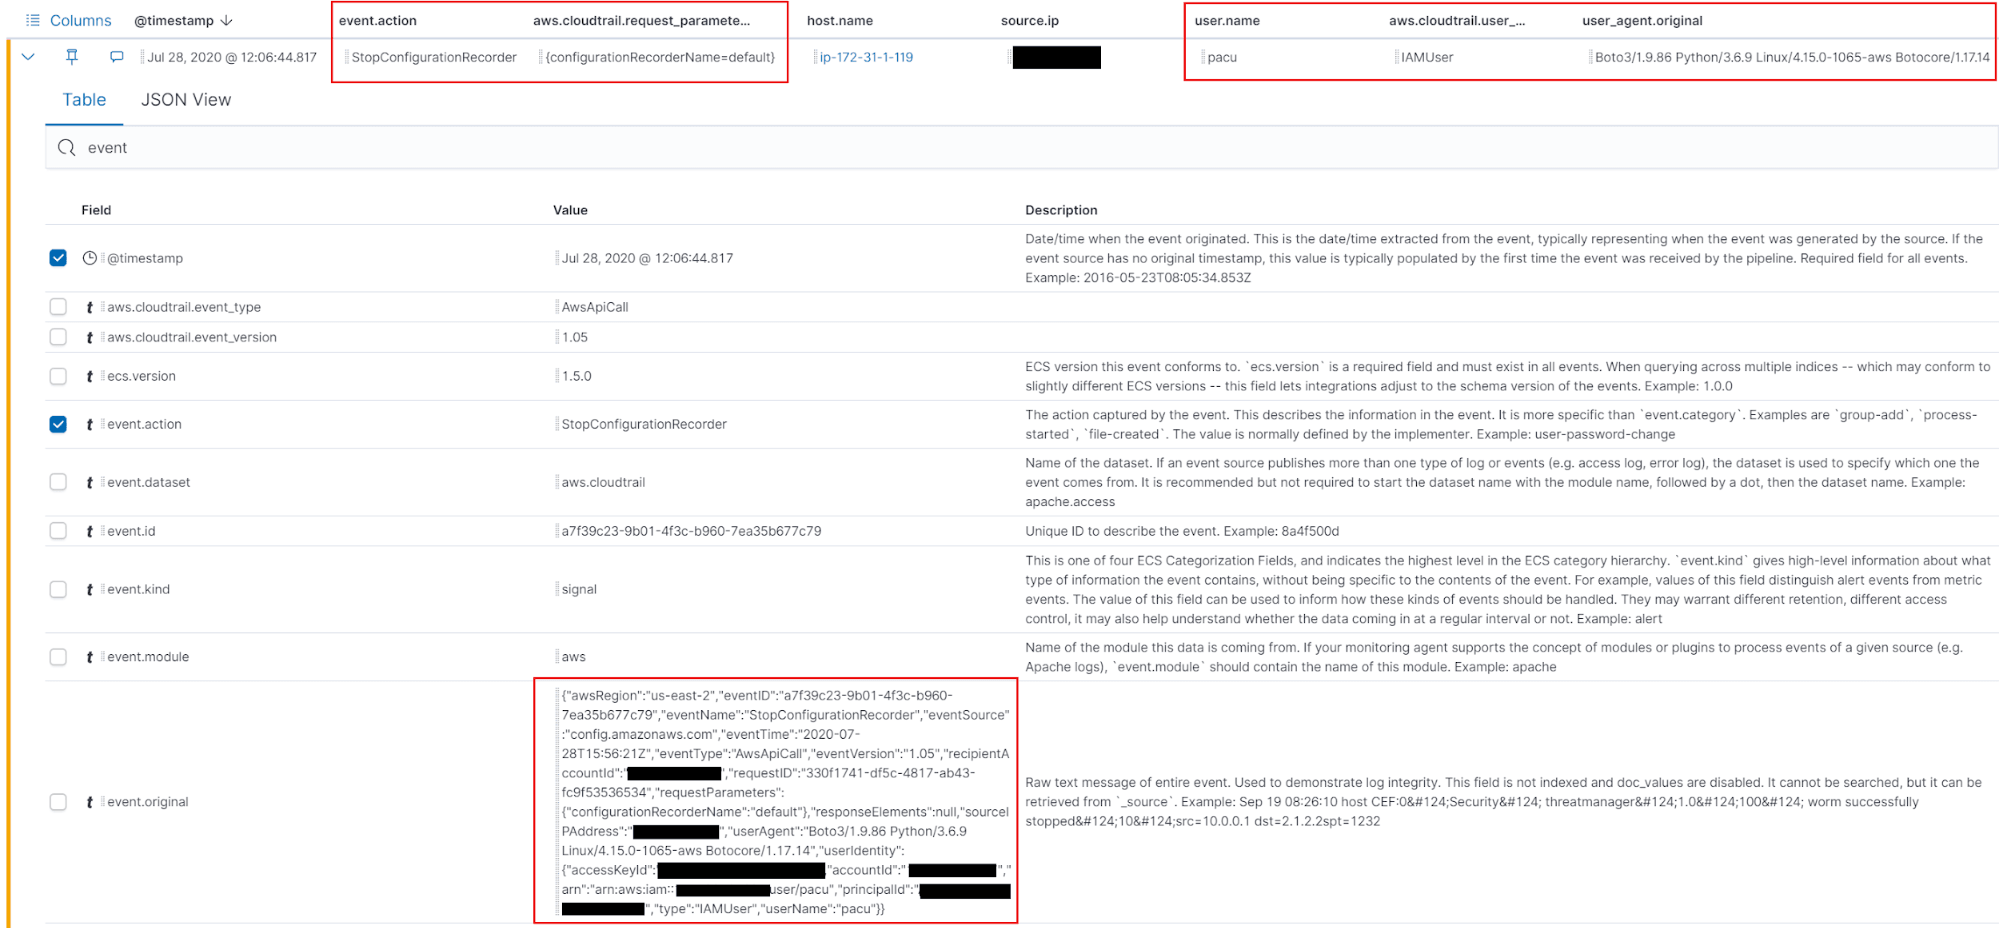
By analyzing the alert, we're able to quickly determine:
| Field | Description |
| event.action | Tells us the AWS API call that was made, StopConfigurationRecorder |
| request_parameters | Gives us the details about what was sent in the request, in our case, the configuration recorder name, default |
| user.name | Informs us as to who made the request, pacu |
| user_identity.type | Contains details about the type of Identity and Access Management (IAM) identity. In our case, an IAMUser. Root is another user identity type we have built in rules for. |
| user_agent | The value of the HTTP User-Agent header. User agent strings can be easily modified, but if an account typically uses the AWS Java SDK for their API calls, and it changes, then the detection of the anomalous user agent string can be a quick win. |
| event.original | Gives us the raw alert details |
Table 1 - Analysis of alert fields
After analyzing the alert, we can start to piece together the events and look at what actions the user took just before our alerts fired (and afterwards as applicable). Again, we can spot the attackers enumeration here as well.
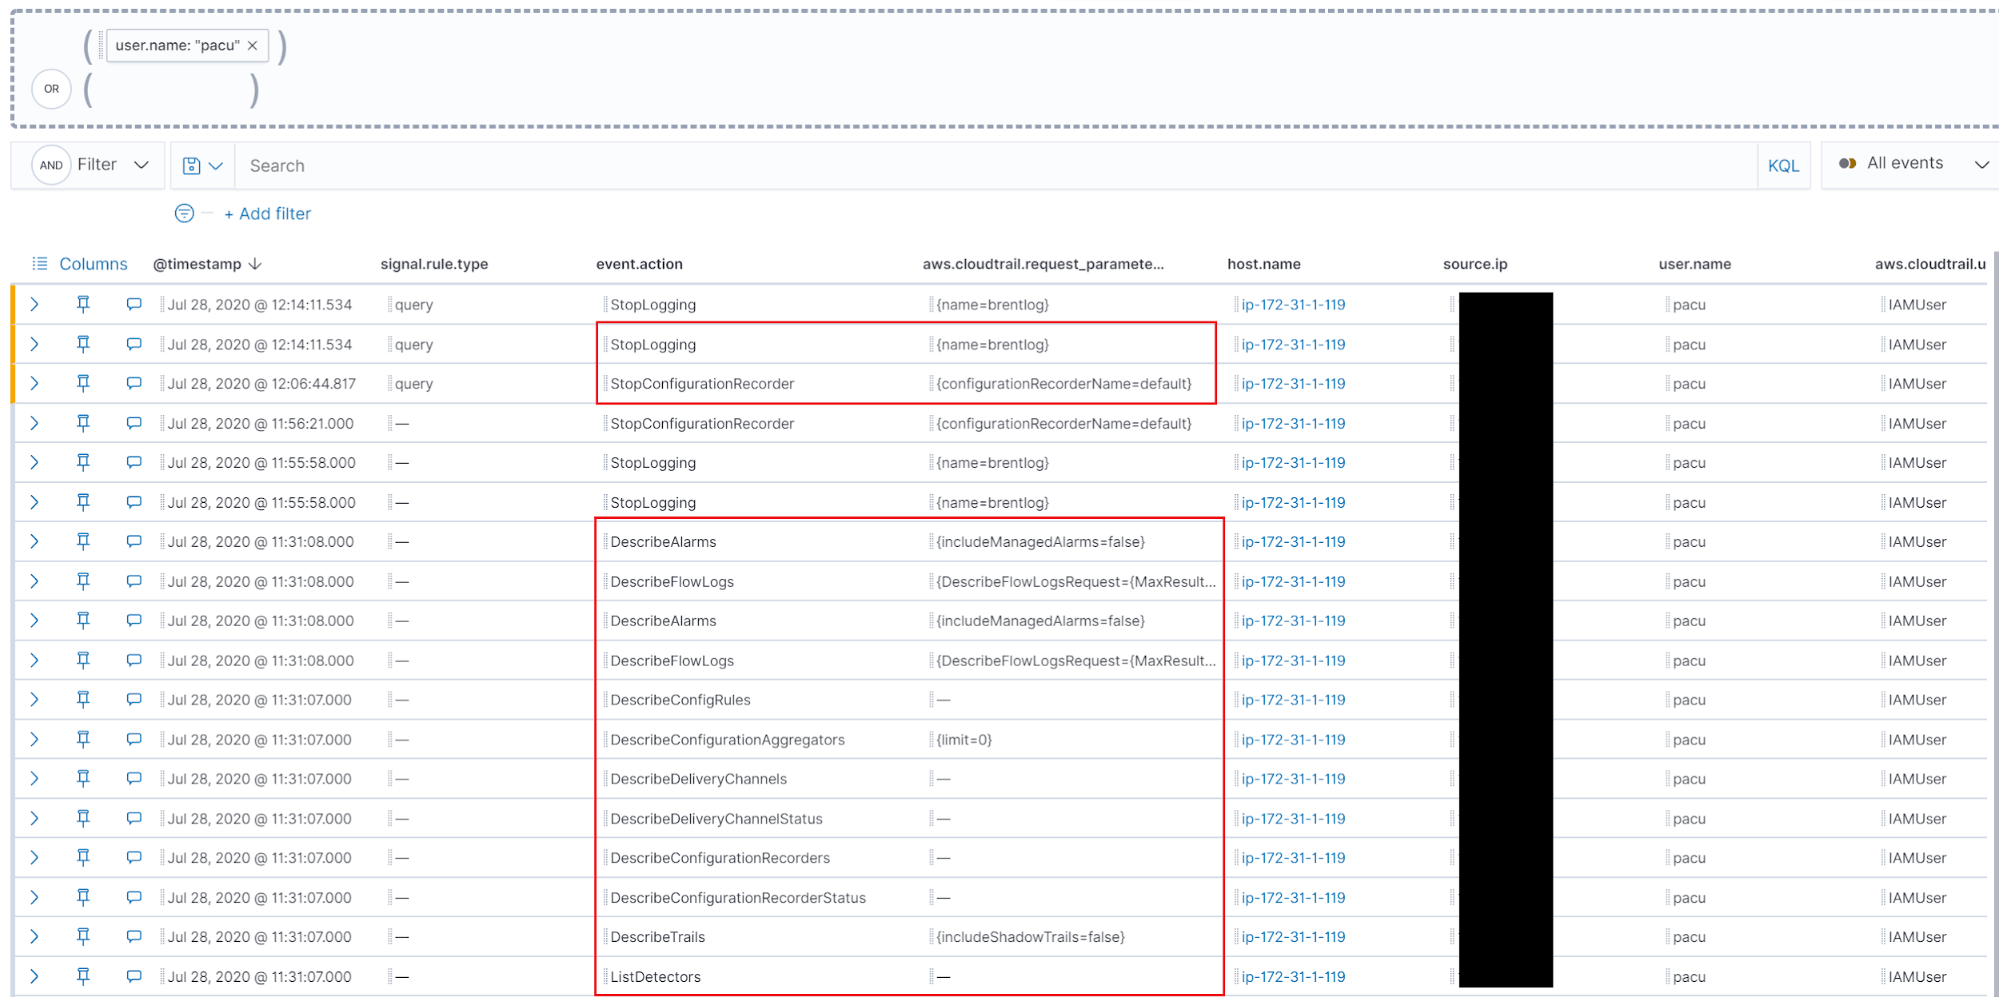
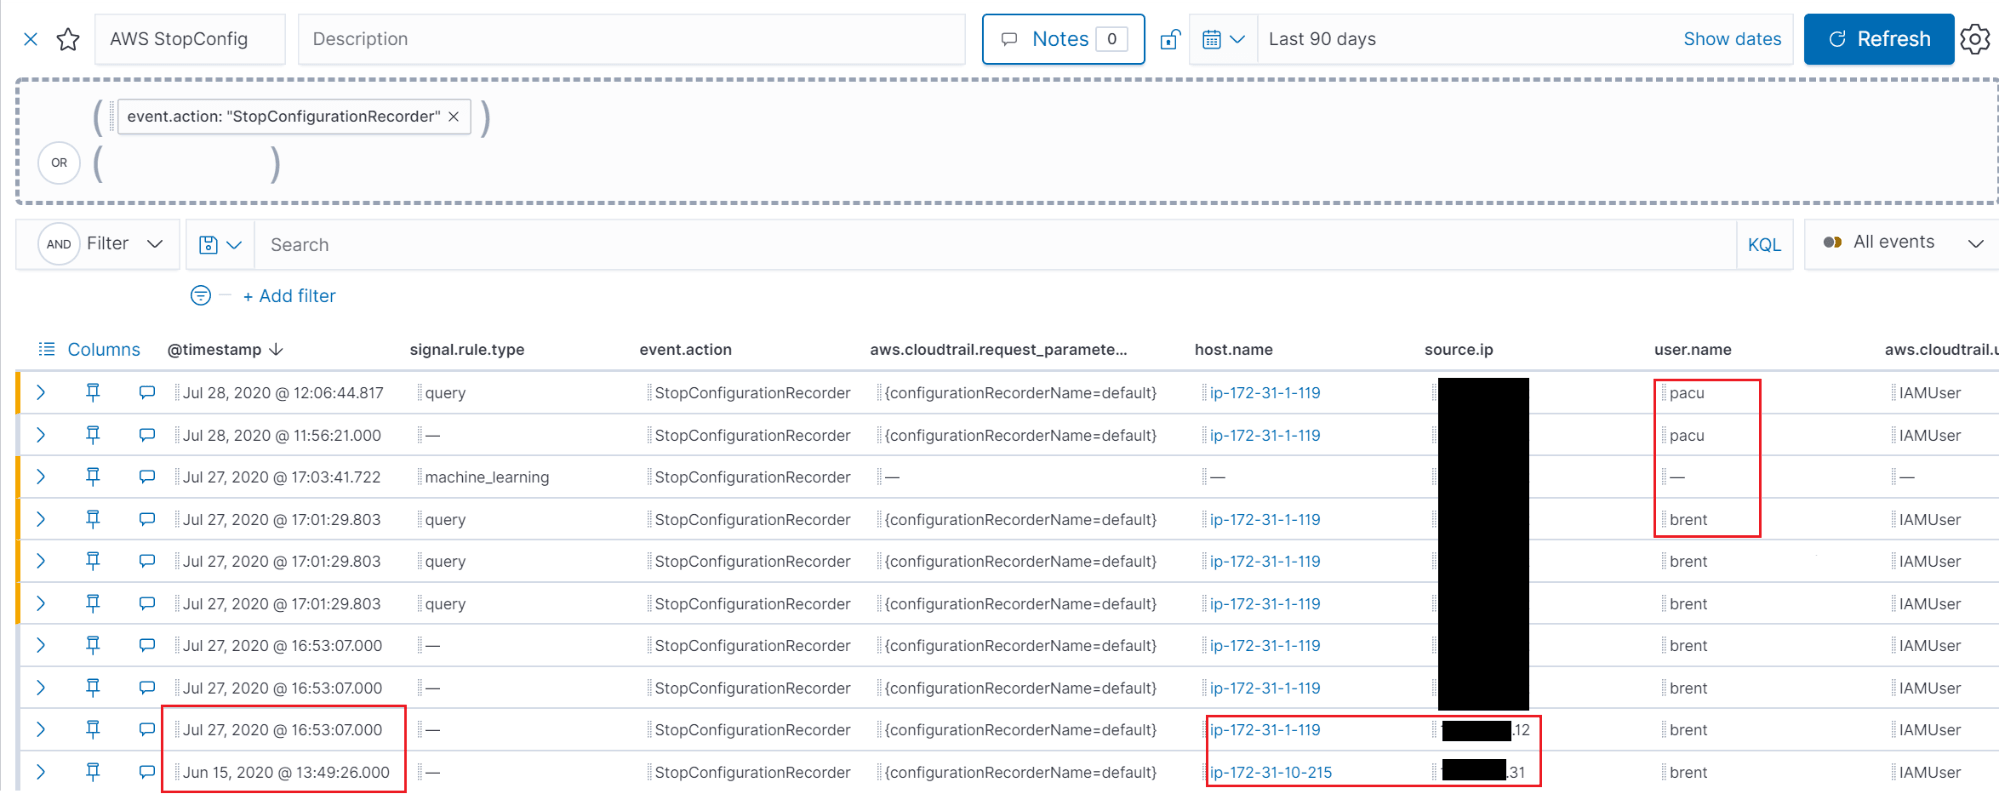
We may also want to search our environment for specific API calls to see if they were invoked by other users or hosts, from different IPs, or at other time frames that would be suspicious in our environment.
We can also create a visualization to look for the least common API calls in our environment and pivot from there. For AWS, the API calls are in the event.action field.
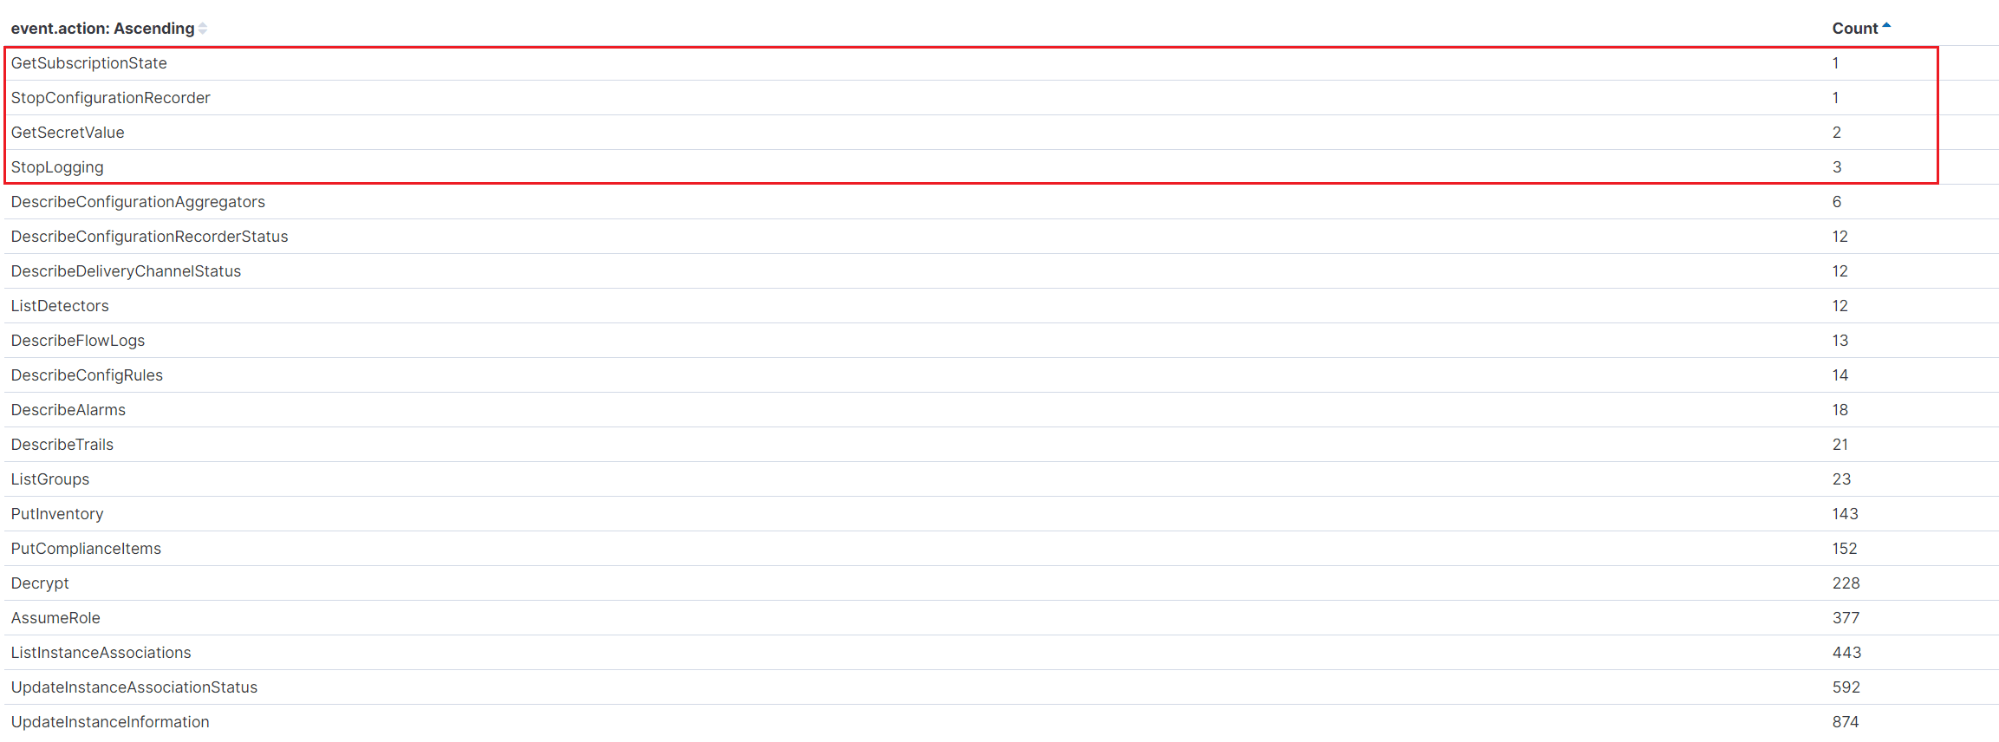
As demonstrated, our free built-in rules for AWS can detect this activity as well as a number of other potential attack scenarios. We've opened up our rules repository and encourage you to have a look and learn how to contribute if interested.
Detecting suspicious behavior in Okta logs
Okta single sign-on (SSO) is a cloud solution that allows users to log into a variety of systems in their organization via a centralized process using a single user account. Informing end users that they only have to remember one username and password instead of ten or more reduces the risk that they'll adopt poor password hygiene and enables system administrators to enforce stronger password policies. Further, multi-factor authentication (MFA) policies can be configured in Okta, which raises the barriers to entry for attackers. Many attackers will simply move on to look for an easier target when they discover that MFA is enforced for their target's network or user account.
While SSO solutions can provide a convenient user experience and reduce cybersecurity risk for an organization, these centralized systems that offer a type of skeleton key to many systems and applications are often an attractive target for attackers. For example, if an adversary manages to harvest an Okta administrator's credentials or API token, they could attempt to perform any of the actions in the non-exhaustive list below:
- Modify or disable MFA policies for one or more applications in order to weaken their victim's security controls.
- Create new user accounts or API tokens to maintain persistence in their target's environment and attempt to “blend in” and evade detection.
- Modify, delete, or deactivate an Okta network zone to loosen the restrictions on which geolocation users or administrators can login from.
- Delete or disable an application or other configuration to create a Denial-of-Service (DoS) condition and impact a company's business operations.
To enable security teams to monitor their Okta environment for suspicious activity, our Okta Filebeat module can pull Okta System Log events and ship them to Elasticsearch to be indexed. Okta's System Log records events related to an organization in order to provide an audit trail that can be used to understand platform activity. The Elastic Security Intelligence & Analytics Team has free rules to detect suspicious activity in Okta logs and will continue adding more in future.
In the following example, imagine that an adversary has harvested an API token after gaining initial access to an organization's network. The API token has administrator privileges and the adversary executes some actions in their target's Oka environment:
- Create a new user account and assign administrative permissions to it in order to maintain a presence in the target environment should the security team discover that the current API token is compromised
- Deactivate a sign-on policy in order to weaken the target's security controls
- Disable a network zone to enable attackers to authenticate from any geographical location during their intrusion
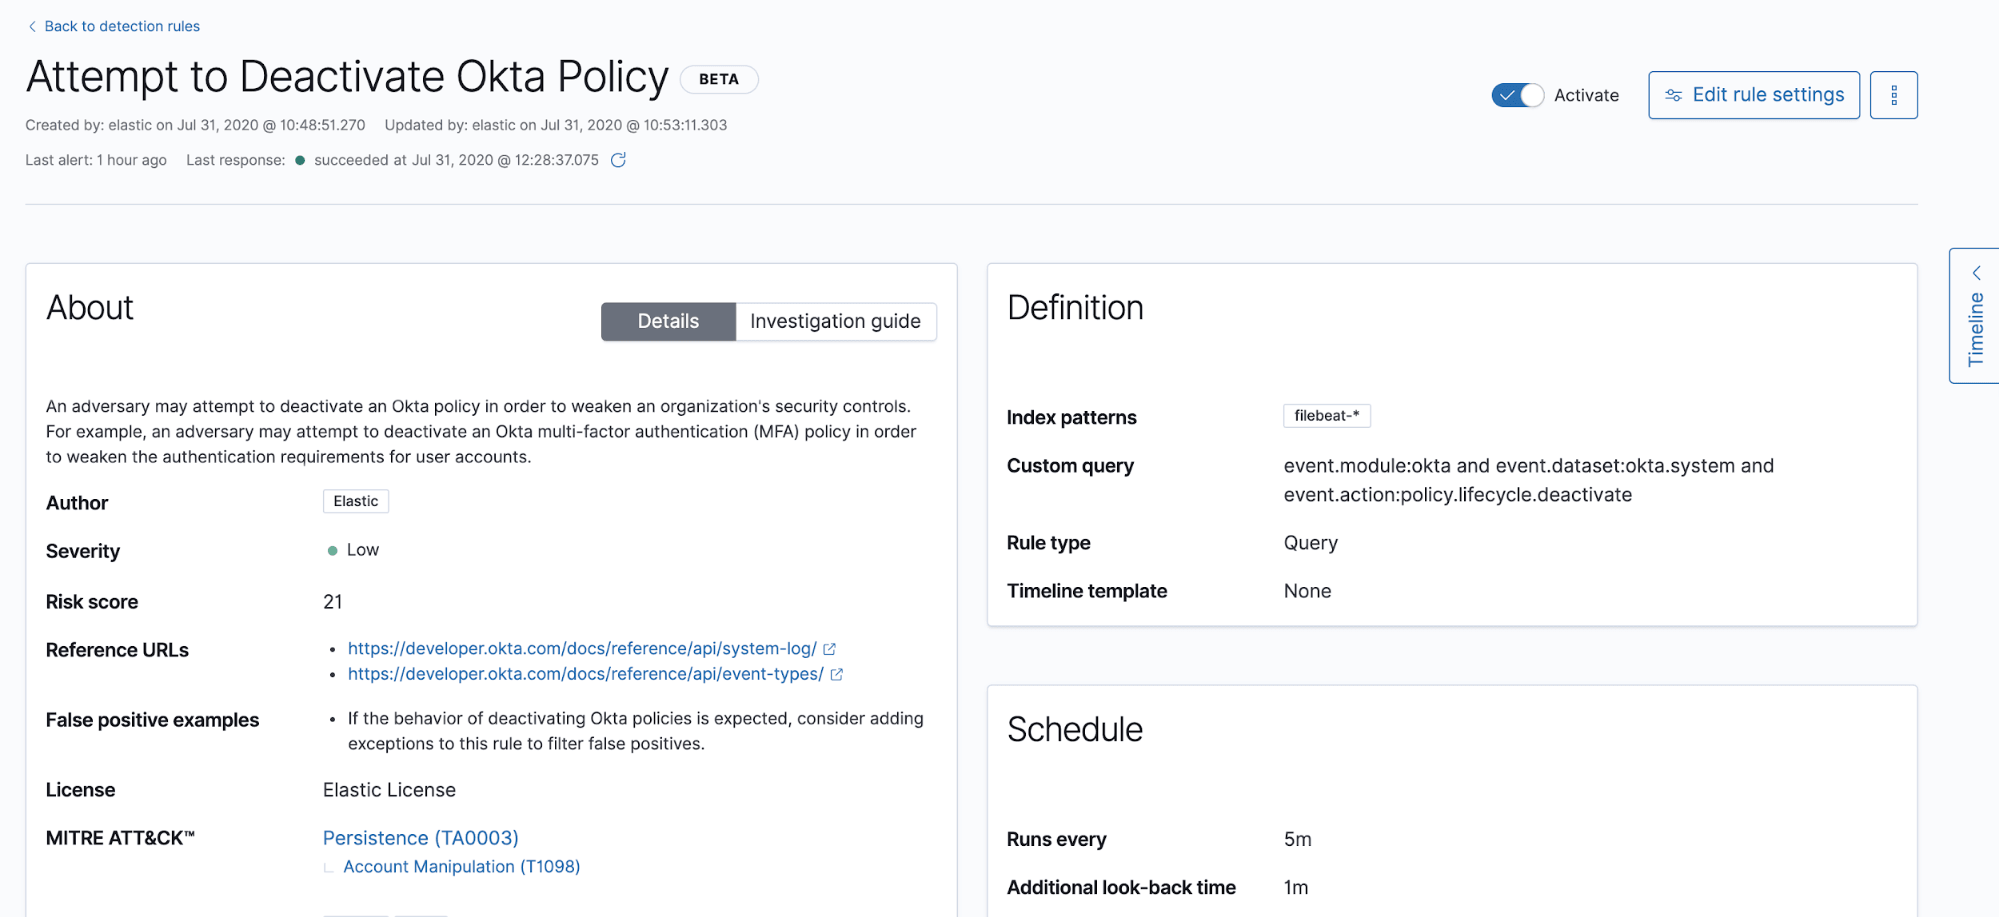
The Okta Filebeat module was configured to ship Okta System Log events to Elasticsearch and our Okta rules were activated in Elastic Security. The suspicious activity triggered three alerts shown in Figure 12 below.

Clicking on one of the alerts allows the analyst to review more information about the rule, including the description of the behavior that the rule detects, severity and risk scores, and the associated MITRE ATT&CK® tactic and technique. The analyst can scroll further down the page and begin to investigate the alert in Timeline.
To learn more how Elastic supports ATT&CK, see our presentation: How to Plan and Execute a Hunt.
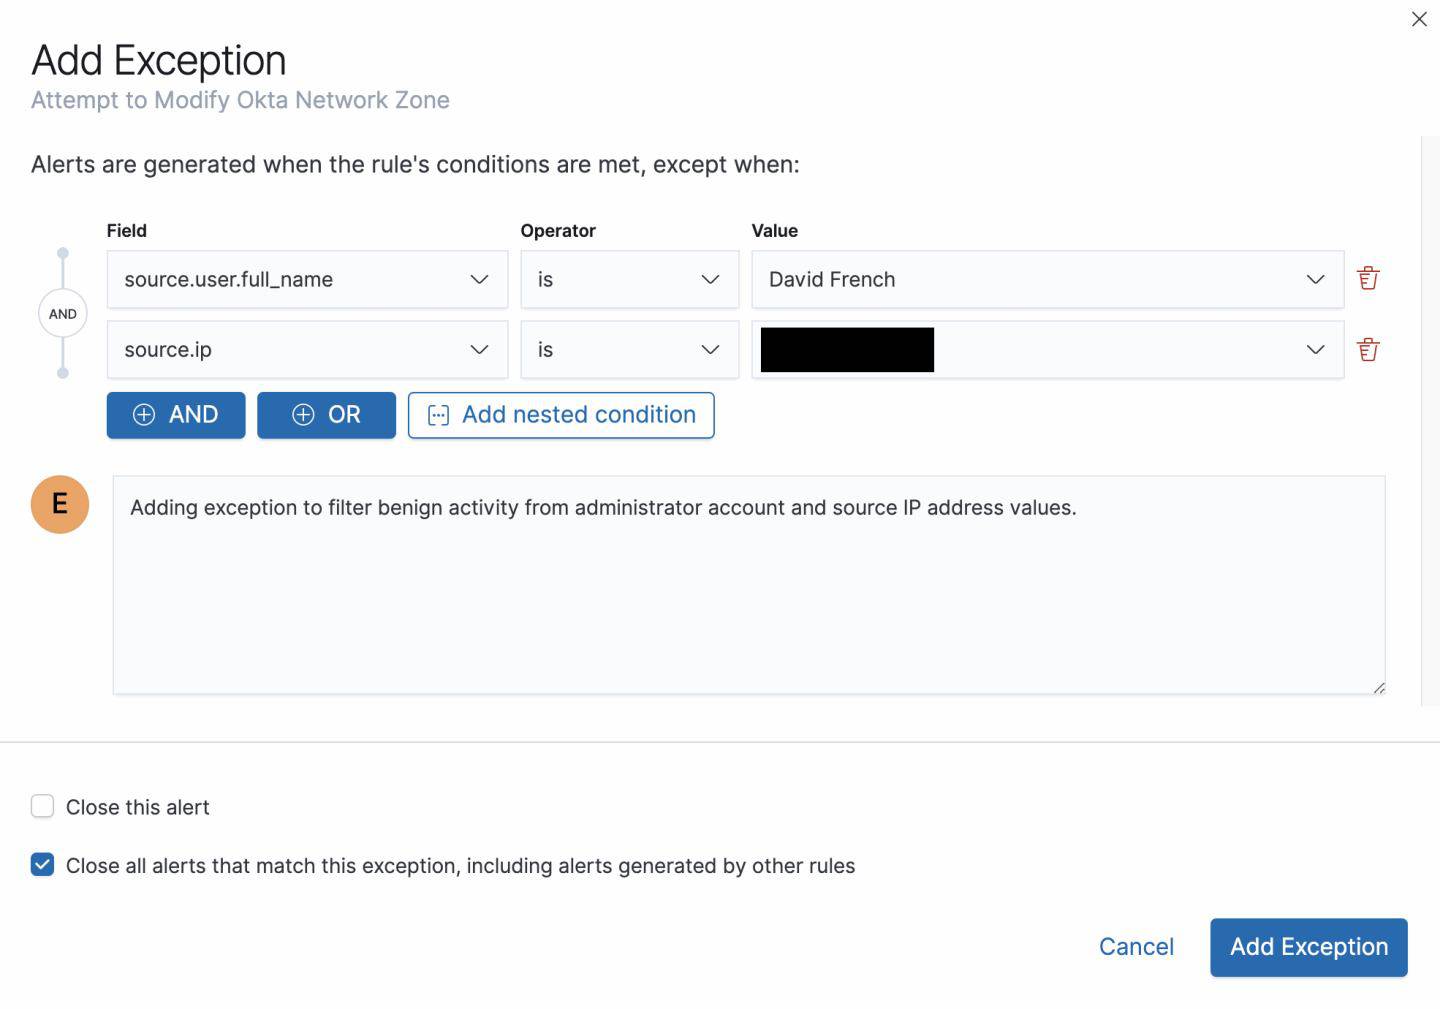
Security practitioners know that every organization's network is different. Behavior that looks suspicious in one environment may be benign in another. To help security teams find the proverbial “signal in the noise,” users can add exceptions to their detection rules to filter benign events and continue to alert on suspicious events. Figure 14 shows an exception being added to an Okta rule.
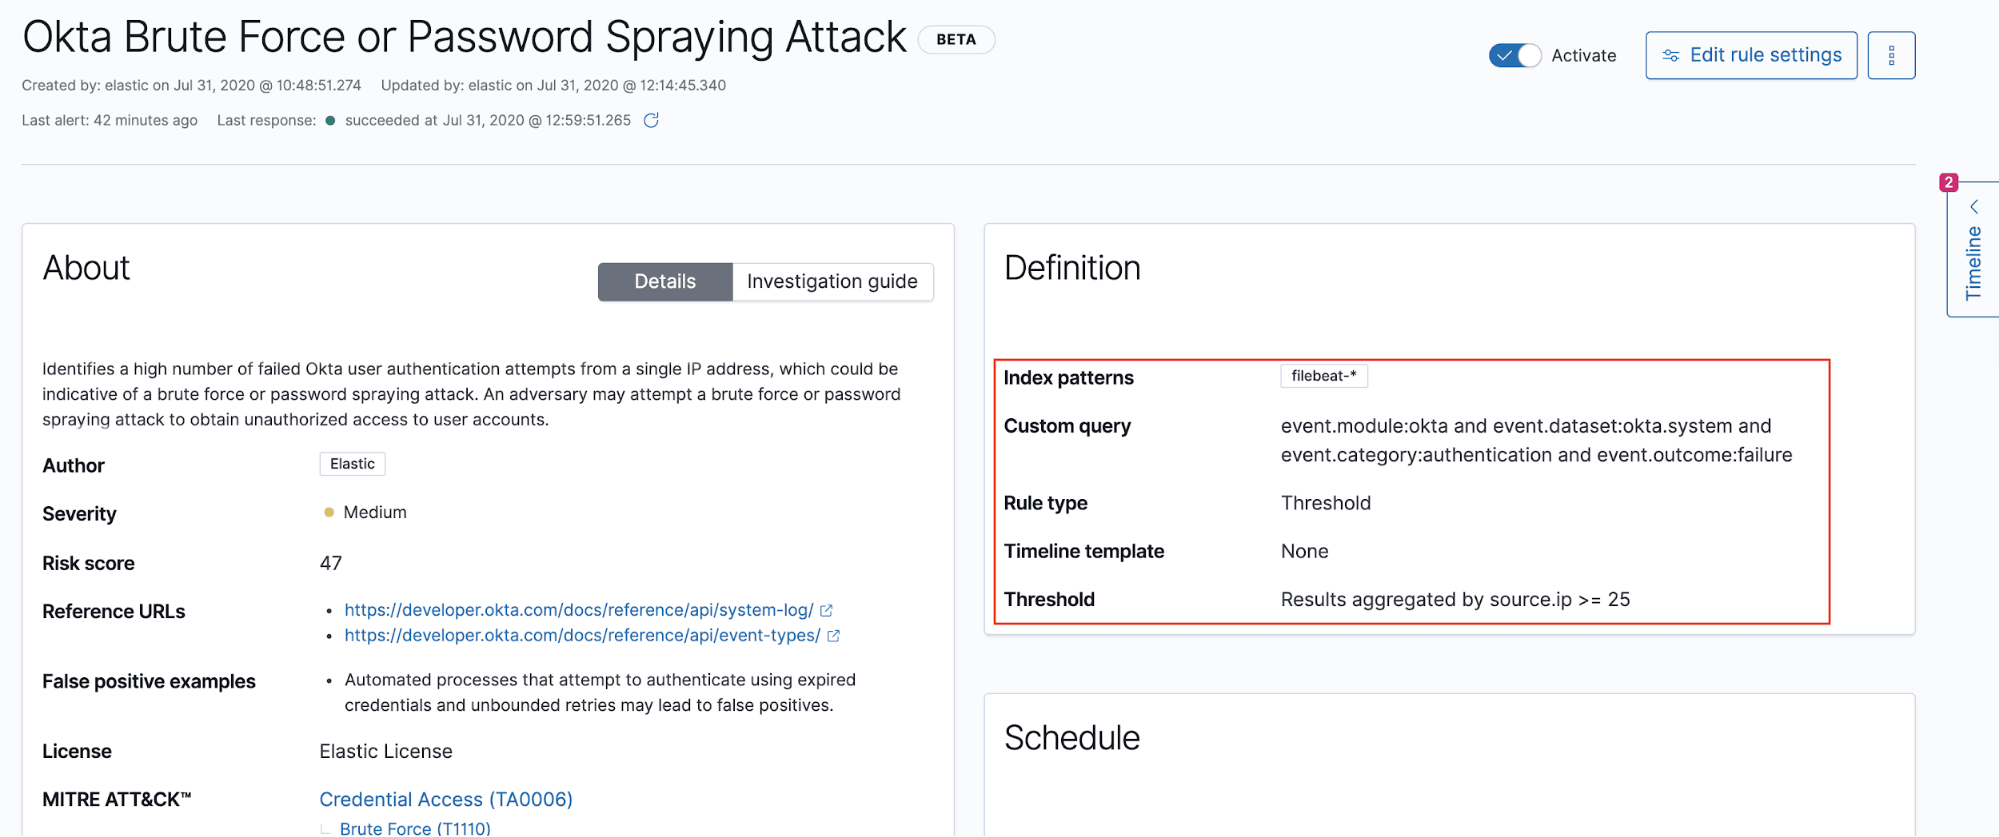
We've also introduced the "threshold" rule type. Threshold rules aggregate query results and generate an alert when the number of matched events exceeds a certain threshold. The example rule below will generate an alert when 25 Okta user authentication failures occur from a single source IP address. This can be indicative of a brute force or password spraying attack.
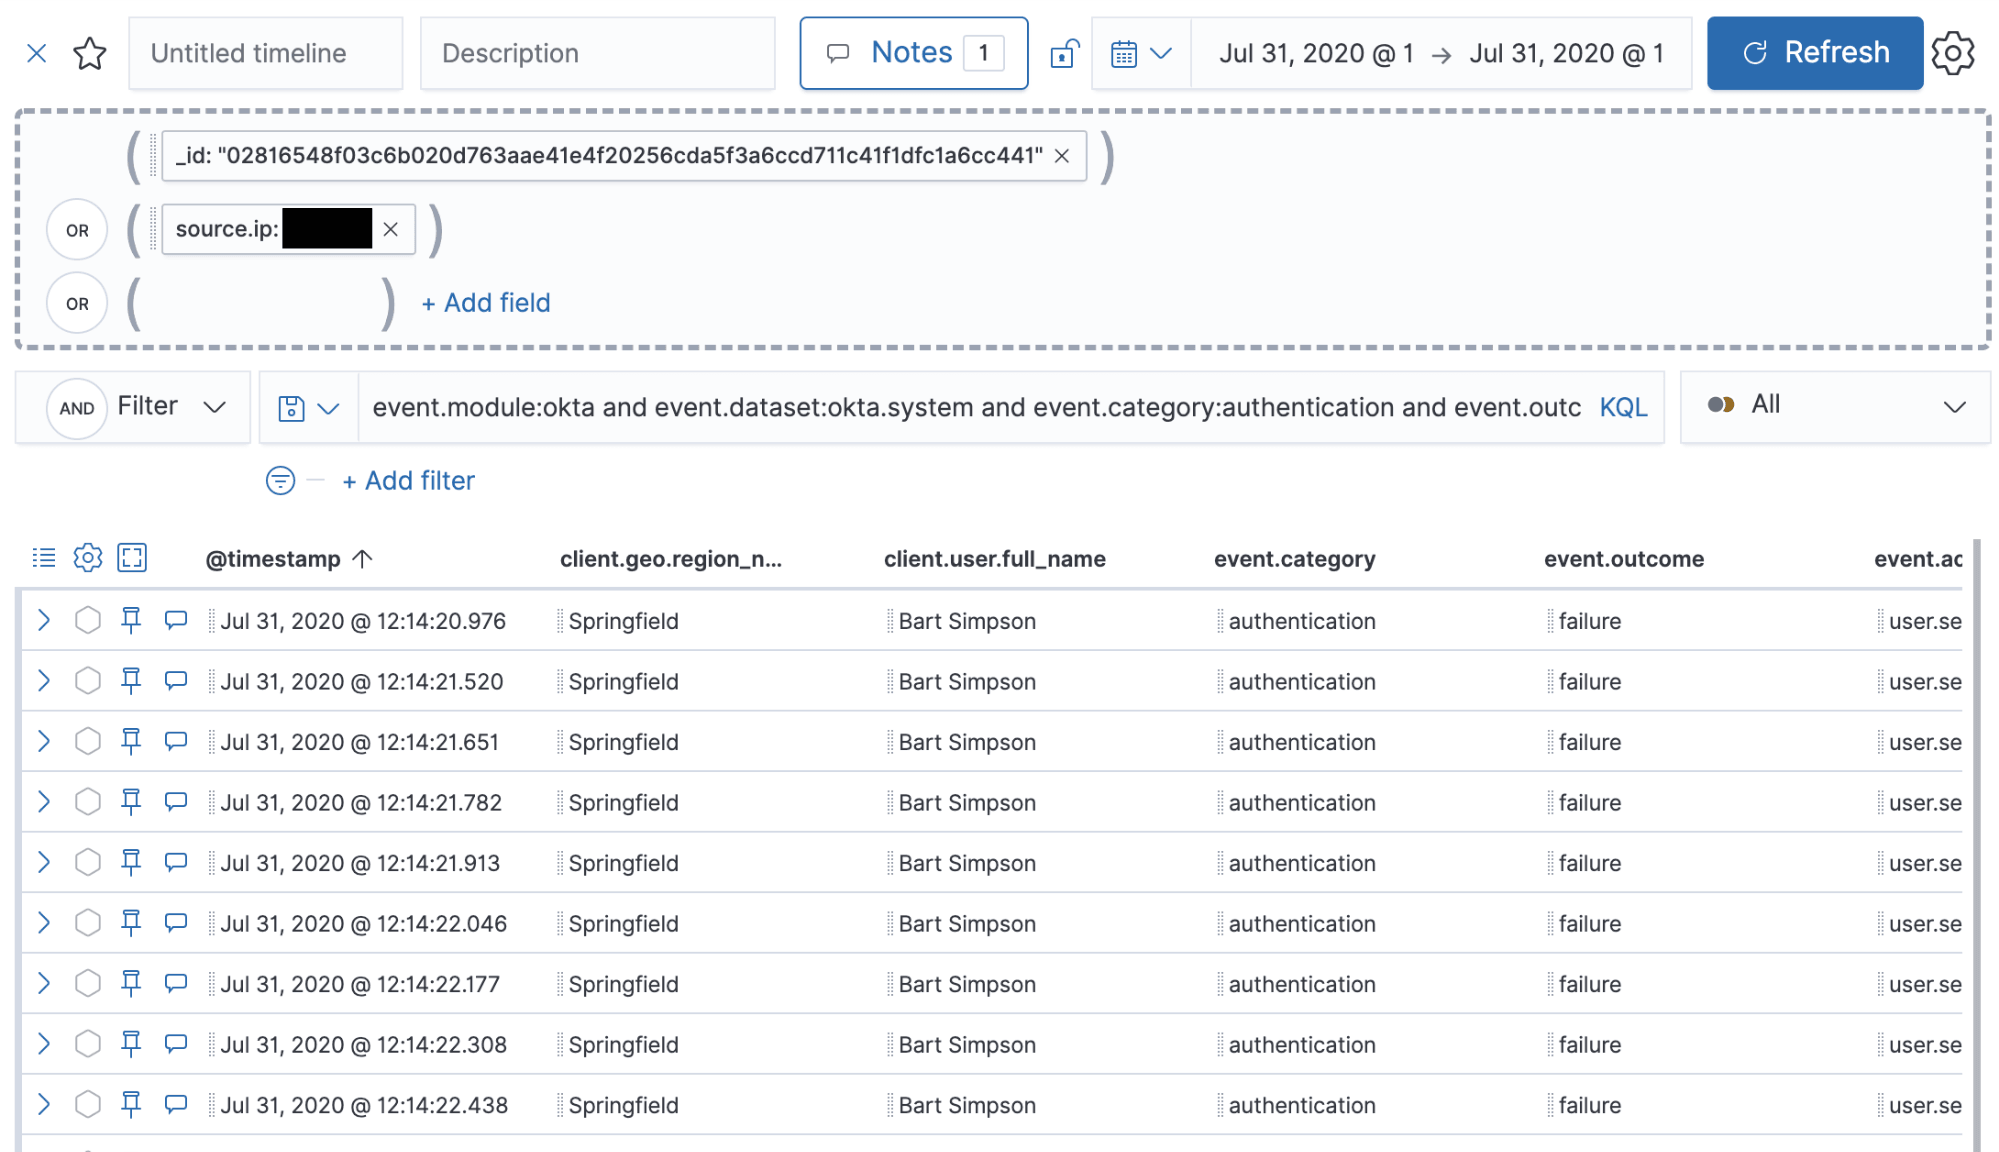
Viewing an alert generated by a threshold rule in the Timeline allows an analyst to review the events that triggered the rule and begin their triage process or investigation.
Conclusion
According to Verizon's latest Data Breach Investigations Report, cloud assets were involved in 24% of the report's 3,950 data breaches reviewed last year. As organizations continue to migrate their data and business operations to the cloud, we can expect this number to increase.
In this blog post, we discussed some of the challenges that security teams face when attempting to monitor for, detect, and investigate suspicious behavior in their organization's cloud environments. We walked through some practical examples on how attackers operate in cloud environments and how Elastic Security can detect those techniques.
The Elastic Security Intelligence & Analytics Team researches adversary tradecraft and develops new detection rules and machine learning jobs for multiple platforms including cloud. Our users can expect to see our continued focus on increasing the cost of cloud attacks.
Configuring our Filebeat modules to ship logs to Elasticsearch and enable detection rules in Elastic Security is easy. Our free detection rules help security teams monitor those logs and detect suspicious behavior, regardless of the size of their team. Elastic Security enables analysts to triage and investigate those alerts quickly and efficiently.
If you're interested in learning more about Elastic Security, you can download it for free or sign up for a free 14-day trial of Elastic Cloud.
